EngageNY
Exponential Growth—U.S. Population and World Population
Show how exponential growth can look linear. Pupils come to understand the importance of looking at the entire picture as they compare the US population to the world population. Initially, the populations look linear with the same rate...
Curated OER
Exponential Population Growth
In this exponential population growth worksheet, students read word problems and determine the exponential growth of a specified populations. They find the percent of growth and compute exponential regressions. Students graph...
Curated OER
Rate of Coral Growth
Using a table of information provided, middle school marine biologists chart data on a graph to determine the impact of water depth on coral growth in Australia's Great Barrier Reef. Then they answer questions that connect the data to...
Curated OER
Population Biology
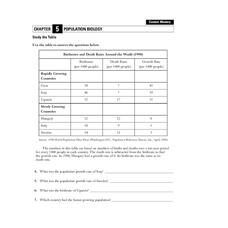
For this population worksheet, students will use a table with information about the birth rates and death rates from different countries around the world to complete 4 short answer questions.
Curated OER
In the Billions and Exponential Modeling
Modeling population growth gives learners an opportunity to experiment with real data. Comparing the growth rates in this real-life task strengthens learners' understanding that exponential functions change by equal factors over equal...
Curated OER
Exponential Models
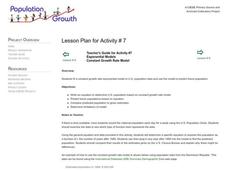
Students fit a constant growth rate exponential model to U.S. population data and use the model to predict future population. They write an equation to determine U.S. population based on constant growth rate model.
Curated OER
Corporate Tax Rate and Jobs
Does lowering the corporate tax rate help create jobs in the United States? Learners explore the top pro and con arguments and quotes relating to the issue. They read background information about the creation of the federal corporate...
Curated OER
The Smelly Sandwich Case
In this exponential function worksheet, students theorize the growth rate of bacteria found on a sandwich hidden in a student's locker. There are 6 questions to answer to solve the mystery.
Curated OER
Birth, Growing, and Aging
In this human development worksheet, students will review the three stages of birth and how your growth rate changes from childhood through adolescence to adulthood. This worksheet has 3 short answer questions, 4 fill in the blank, and 5...
Curated OER
Maple Trees, Syrup, and Sugarbush Math
In this math word problems worksheet, learners complete math word problems dealing with maple trees, syrup, and a sugar bush. Students complete 6 problems where they click on links and that contain growth rate, percentages, measurement,...
Curated OER
Rates of Change
In this rate of change worksheet, students read about how to calculate the rate of change in different processes such as plant growth. They are given example problems and practice calculating rates of change.
EngageNY
Percent Rate of Change
If mathematicians know the secret to compound interest, why aren't more of them rich? Young mathematicians explore compound interest with exponential functions in the twenty-seventh installment of a 35-part module. They calculate future...
West Contra Costa Unified School District
Interest and the Number e
Mary, Mary, quite continuously, how does your money grow? Uses examples to examine the difference between simple interest and compound interest, and to take a look at different rates of compounding. Learners explore what would happen as...
PBL Pathways
What Should Have Happened on Gilligan's Island?
"Just sit right back and you'll hear a tale ..." Gilligan's Island is a classic that spans generations and offers a problem-solving opportunity for scholars. Take a project-based learning approach to examine the population of the island....
Curated OER
Integrated Algebra Practice: Exponential Growth
For this exponential growth worksheet, learners solve 10 multiple choice and short answer problems. Students find the interest of an amount of money given the rate, time, and times compounded.
Curated OER
Logistic Growth
Through the exploration of population growth of a bacteria population, students learn about and observe bacteria population over a 20 hour period. Students graph the population growth using a scatter plot and discuss its logistic...
Curated OER
NUMB3RS Activity: Exponential Growth
Mathematicians investigate exponential growth by exploring two different options for receiving allowance. Young scholars use technology to compare a linear function with a constant rate of growth to a function that grows exponentially...
Curated OER
Temperature Affects The Heart Rate
Students relate heart rate and development to environmental conditions through experiment. In cooperative groups, students record the heart rate in developing zebra fish. Groups create a standard curve to predict the temperature at...
Concord Consortium
People and Places
Graph growth in the US. Given population and area data for the United States for a period of 200 years, class members create graphs to interpret the growth over time. Graphs include population, area, population density, and population...
Illustrative Mathematics
Baseball Cards
Here is a resource that demonstrates growth and the initial state of an equation. In this case, your class will be looking at baseball collections. How many baseball cards did the collector start out with, and how many were added or...
Curated OER
Population and Productivity: Two P's in a Pod
Students investigate the link between countries' population growth rates and levels of industrialization. They observe that, over time, as a country becomes more industrialized, its population growth rate decreases.
Curated OER
Human Population- Changes in Survival Rates Data Interpretation
In this human population changes in survival worksheet, students interpret and plot data to understand the differences in human mortality and survivorship between historic and modern times. They investigate how these changes influence...
Curated OER
Piecewise Linear Functions: Extending Stories to Graphs
Using this resource, scholars develop graphs that model situations by showing change over time. They answer 15 questions based on information from charts that show growth in weight. They extend the concepts to an assessment section of...
California Education Partners
Science Fair Project
Plant the data firmly on the graph. Given information about the growth rate of plants, pupils determine the heights at specific times and graph the data. Using the information, scholars determine whether a statement is true and support...
Other popular searches
- Linear Growth Rates
- Population Growth Rates
- Growth Rates in Plants
- 10 Year Growth Rates
- Growth Rates Money


