Curated OER
When Dinosaurs Ruled the World
Students graph the varying sizes of dinosaurs. In this math and dinosaur lesson, students view dinosaur models and compare the different shapes and sizes of the dinosaurs. Students complete a dinosaur math activity, read The Dinosaur...
Curated OER
Student Heights
Students measure the heights of their fellow classmates and create a box and whisker plot to display the data. In this measurement lesson plan, students analyze the data and record results.
Curated OER
Dealing With Data
Students collect, organize, and display data using a bar graph, line graph, pie graph, or picture graph. They write a summary describing the data represented and compare the graph to another graph in the class.
Curated OER
Questionnaires and Analysis
In this questionnaires and analysis worksheet, students design a questionnaire and then select a sample. They organize and analyze data. This four-page worksheet contains 1 multi-step problem. Explanations and examples are provided.
Teach Engineering
Making Moon Craters
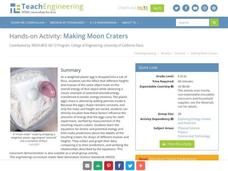
Create an egg-citing study of energy. Pupils investigate the effect of height and mass on the overall amount of energy of a falling object. The fourth segment in a six-part series on energy uses a weighted egg falling from different...
Radford University
Are Kitchen Cabinets at the Correct Height? Lessons 1-5
Here's a not-so-normal unit on normal heights. Future statisticians anonymously collect class data on female heights, weights, and shoe sizes. They then analyze the data using normal distributions, z-scores, percentiles, and the...
Teach Engineering
Fun with Air-Powered Pneumatics
How high did the ball go? Engineering teams build a working pneumatic system that launches a ball into the air. The teams vary the amount of pressure and determine the accompanying height of the ball. An extension of building a device to...
Curated OER
Evaluating Data
In this data worksheet, students learn how to organize the data collected during an experiment and practice finding patterns. Students graph a table of experimental data and complete 1 short answer question.
Curated OER
Using Math Concepts to Collect and Document Specimens
Students determine the length and width of leaf samples to the nearest millimeter and the circumference of trees. They participate in a discussion about the importance of collecting specimens carefully. They compile accurate...
Curated OER
Digital Statistics
Research data analysis by creating charts in class. Define the differences between an "average" and "range" while examining measurement data based on student height. Utilize computer software to create a height graph which is shared with...
Curated OER
Variation and Heredity
Junior geneticists tally eye color and height in their lab groups. They examine certain traits in soybean and corn seedlings. For each activity, they gather data and learn about continuous and discontinuous genetic variation. In another...
Curated OER
Bouncing Ball
High schoolers collect height versus time data of a bouncing ball using the CBR 2™ data collection device. Using a quadratic equation they graph scatter plots, graph and interpret a quadratic function, apply the vertex form of a...
Virginia Department of Education
Graphs
Examine different types of graphs as a means for analyzing data. Math scholars identify the type of graph from a series of data displays and then develop questions to match each one. Then, given a scatter plot of height versus age data,...
Wind Wise Education
What are Wind Shear and Turbulence?
Let's go fly a kite. By flying a kite, class members observe the difference in air flow. The class notices the characteristics of banners tied to the kite string to determine where wind turbulence stops. Adding an anemometer to measure...
California Education Partners
Science Fair Project
Plant the data firmly on the graph. Given information about the growth rate of plants, pupils determine the heights at specific times and graph the data. Using the information, scholars determine whether a statement is true and support...
Curated OER
Computing Mean, Mode and Median
Ninth graders collect data on basketball player's heights and determine the mean, median, and mode for the data.
Curated OER
How High Are the Clouds?
Pupils analyze height and collect data to create a graph. In this statistics lesson, students use central tendencies to analyze their data and make predictions. They apply concept of statistics to other areas of academics to make a...
Curated OER
Famous Authors Biographical Data Form
Who wrote To Kill a Mockingbird? What about Wuthering Heights? Prodigal Summer? Encourage learners to study the authors of their beloved books. This form will help them organize information as they learn about different authors. After...
Curated OER
Fitting a Line to Data
Students work together in groups to collect data in relationship to how much water marbles can displace. After the experiment, they use the data to identify the linear equation to determine the best-fit line. They use the equation to...
Curated OER
Thinking Outside the Box
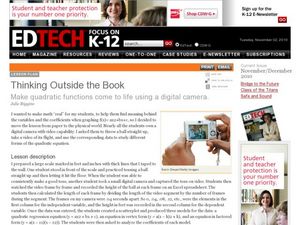
Now this instructional activity sounds fun! Students throw a ball, film it as it soars through the air, and use a spreadsheet to collect data. A scatterplot is created to produce a quadratic regression equation, an equation in vertex...
Clarkson University
Understanding Energy (With a Pendulum)
Have you ever wanted to play with a giant pendulum? An experiment allows small groups to do just that. They gather data and make observations as they complete the included worksheet. The lesson plan lays out each instruction including...
Balanced Assessment
Toilet Graph
Mathematics can model just about anything—so why not simulate the height of water in a toilet bowl? The lesson asks pupils to create a graphical model to describe the relationship of the height of the water as it empties and fills again....
Curated OER
Acceleration Lab
Young Einsteins experiment with the acceleration of Hot Wheels™ toy cars down inclined planes at various angles. This classic physics lab activity is thoroughly explained in both a teacher’s guide and a student lab sheet. Science...
University of Saskatchewan
Using Conservation of Energy to Determine Average Impact Force
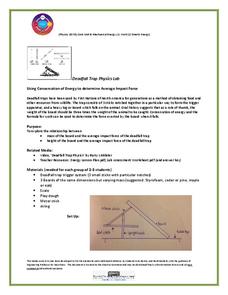
Explore the center of gravity with your science class as they create a deadfall trap with common materials. They research the concepts of energy conservation and gravitational force before dividing into small groups to create a model of...


