Curated OER
Real Misleading Graphs
Students identify real graphs and misleading graphs. In this algebra lesson, students surf the Internet for real life scenarios where graphs are used in a misleading way as well as in a correct way.
Curated OER
Venn Diagram and UK Basketball
Students analyze data and make inferences. In this algebra activity, students collect and analyze data as they apply it to the real world.
Curated OER
Students Analyze Data With Scatter Plots
Scatter plot lessons can help students create different types of graphs by hand or with the aid of technology.
Curated OER
Graphing Lesson Plans
By using hands-on graphing lesson plans students can learn how to collect data, and display the information using graphs.
Curated OER
Positive Future Fair Project
Ninth graders view the film "Pay It Forward" and discuss what kind of public campaign is needed to move people to positive action. They consider different ways of presenting information (graphs, visual displays, etc.) as tools for...
Curated OER
Expected Outcome (Probability)
Students practice and determine expected values of experiments as well as distributions of experiments. They find the area of rectangles and circles and determine elementary probabilities. Probability exercises begin with quarters and...
Curated OER
Problem-Solving Application: Use a Graph
In this problem solving worksheet, 6th graders use the problem solving steps of understand, plan, solve and look back to answer a graphing question.
Curated OER
Assessing Normalcy
Students define normal distribution as it relates to the bell curve. In this statistics lesson, students use the central tendencies of mean, median and mode to solve problems. They plot their data and draw conclusion from the graphs.
Curated OER
Box Plots
Young scholars review the concept of median, explore how to calculate quartiles for any size data set and experience how to build a box plot.
Curated OER
Sets an the Venn Diagram
Students explore the characteristics of sets and Venn Diagrams. Given data, students practice determining the placement of elements in a Venn Diagram. Students discuss the correspondence between data sets and their graphical...
Curated OER
Stem-and- Leaf Plots
Learners are introduce to the notion of stem-and-leaf plots. They use stem-and-leaf plots to calculate the mean, median, and mode of a set of data. Students use computers to learn about stem-and-leaf plots.
Curated OER
Line & Scatter (What Would You Use: Part 2)
High schoolers discuss line graphs and scatter plots and the best situations in which to use them. Using the graphs, they determine the type of correlation between variables on a scatterplot. They create a scatterplot and line graph...
Curated OER
The Dog Days of Data
Students practice an alternative form of data presentation. They practice sequencing data, identifying the stem-and-leaf, creating stem-and-leaf plots, and drawing inferences from the data by viewing the plots.
Curated OER
The Dog Days of Data
Students are introduced to the organization of data This lesson is designed using stem and leaf plots. After gather data, they create a visual representation of their data through the use of a stem and leaf plot. Students
drawing...
Curated OER
Breakfast Cereal - How Nutritious Is Yours?
Middle schoolers analyze the nutritional value of breakfast cereal in order to make an informed choice. They create a stem and leaf plot which analyzes the nutritional value of the cereal they eat on a regular basis. Students write a...
Curated OER
Education for Global Peace
Students survey the class and graph the results. In this graphing and data collection lesson plan, students conduct a survey to see where their shirts were produced. Individuals use software to graph the results and create a written...
Curated OER
Power Metering Project
Students collect and analyze variable data and understand the concept of electrical power. In this energy lesson students use a spreadsheet to manage their data and create box plots.
Alabama Learning Exchange
The State Capital of Stem and Leaf
Students explore the concept of stem and leaf plots. In this stem and leaf plots lesson, students plot the 50 US states' capitals on a stem and leaf plot according to the first letter of each state. Students compare their stem and leaf...
Curated OER
An Introduction to Elementary Statistics
Students explain and appreciate the use of statistics in everyday life. They define basic terms used in statistics and compute simple measures of central tendency.
Curated OER
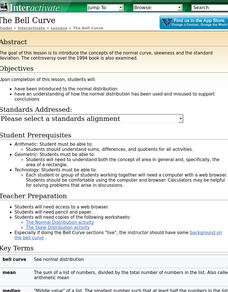
The Bell Curve
Students are introduced to the normal distribution and examine the bell curve controversy.
Curated OER
Dynamite Data
Second graders rotate through a variety of stations designed to offer practice in manipulating data. They sort, tally and count items and then create bar graphs, tables, and pie graphs to record their findings.
Curated OER
Leap Frog Experiment
Second graders ask questions and design an experiment to explore different spinners in "The Leap Frog" board game. They conduct their experiment, collect information and interpret the results using a graph.
Curated OER
What on Earth is Greater Than?
Students compare things that are greater than, less than, or equal to, compare the Earth to other planets, and list planets from greatest size to smallest size.
Curated OER
A Bar of Many Colors
Second graders use colored candies to collect data, construct double bar graphs, and find averages.
Other popular searches
- Histogram and Bar Graph
- Bar Graphs and Histograms
- Bar Graphs Histograms
- Interpreting Histograms
- Histogram Analysis
- Cumulative Frequency Histogram
- Construct a Histogram
- Histogram Activities
- Creating Histograms
- Making Histograms
- Frequency Histograms
- Frequency and Histograms


