Thomson Brooks-Core
Complex Numbers
A straightforward approach to teaching complex numbers, this lesson addresses the concepts of complex numbers, polar coordinates, Euler's formula, De moivres Theorem, and more. It includes a practice problems set with odd answers and a...
EngageNY
Mid-Module Assessment Task - Algebra 2 (Module 1)
Challenge classes to think deeply and apply their understanding of polynomials. The assessment prompts learners to use polynomial functions to model different situations and use them to make predictions and conclusions.
Cornell University
Catapults
Ready, aim, fire! Launch to a new level of understanding as scholars build and test their own catapults. Learners explore lever design and how adjusting the fulcrum changes the outcome.
Curated OER
Famous People: Teacher Notes
Young statisticians practice creating scatter plots. First, they estimate the age of 14 people. Next, they write down the estimate in a table labeled x. Then write down their actual age in the table labeled y. Using these x and y...
Curated OER
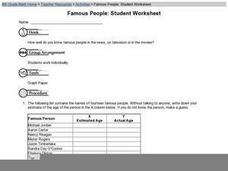
Famous People: Student Worksheet
Older learners consider a list of famous people, and they fill in two columns; one in which they guess the celebrities' ages, and another where they look up their actual age. They construct a graph by assigning one of the columns the x...
Curated OER
Real World Investigation- Math and Geography- Elevation Changes
In this math and geography real world investigation, 6th graders plan a driving trip to a city that is located several states away from their home while recording the elevations of three cities that are included in the trip. They use...
Curated OER
Lesson #46: Bar Graphs and Line Graphs
In this bar graphs and line graphs worksheet, students interpret bar graphs, line graphs, and box-and-whisker plots. They find the measures of central tendency. This three-page worksheet contains notes, vocabulary, and approximately 10...
Primary Resources
Coordinate Pairs: An Introduction
Ordered pairs, the x and y-axis - sounds like it's time to introduce learners to the plotting points on a graph! This presentation is great as it introduces the concept, provides an example of how to use a coordinate plane, and then...
Curated OER
Music and Sports
With so much talent in the classroom, do your musicians and athletes have related interests? This problem has your learners taking data from their classmates to decide whether there is an association between the two activities. The...
Math Sphere
Co-Ordinates
Challenge young mathematicians' understanding of the coordinate plane with this series of skills practice worksheets. Offering 10 different exercises that involve identifying ordered pairs, graphing polygons, and rotating/reflecting...
It's About Time
Volcanic Hazards: Airborne Debris
Pupils interpret maps and graph data related to volcanic ash. Then they analyze the importance of wind speed and the dangers of the ash to both life, air temperature, and technology.
Willow Tree
Histograms and Venn Diagrams
There are many different options for graphing data, which can be overwhelming even for experienced mathematcians. This time, the focus is on histograms and Venn diagrams that highlight the frequency of a range of data and overlap of...
It's About Time
The Sun and Its Effects on Your Community
Why is the sun round? Examine this question, and others, with your pupils while teaching them how to live in a more earth-friendly environment. Pupils explore Sun composition and discuss how solar wind, sunspots, and solar energy affects...
Balanced Assessment
A Fishy Story
There's nothing fishy about this resource. In the task, learners use given information about fish prices to create a scatter plot and line of best-fit. Later, they use the information to answer questions about the profit from fish sales.
EngageNY
Graphing the Sine and Cosine Functions
Doing is more effective than watching. Learners use spaghetti to discover the relationship between the unit circle and the graph of the sine and cosine functions. As they measure lengths on the unit circle and transfer them to a...
Balanced Assessment
Who's Left?
If you're not right-handed, are you wrong-handed? Young statisticians calculate the percentage of left-handed people using a given data set in the assessment task. They plot data on a scatter plot and consider how the line of best fit...
02 x 02 Worksheets
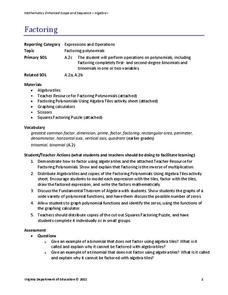
Factoring
Factor in this resource when teaching how to factor polynomials. Scholars use algebra tiles to factor linear and quadratic expressions. They practice their skill by working on example problems from a worksheet.
EngageNY
Multi-Step Problems in the Real World
Connect graphs, equations, and tables for real-world problems. Young mathematicians analyze relationships to identify independent and dependent variables. These identifications help create tables and graphs for each situation.
CPALMS
2D Rotations of Triangles
Where does the line of rotation need to be to get a cone? Pupils respond to three questions involving rotating a right triangle about different lines. The scholars describe the solid created along with providing details about its...
CCSS Math Activities
Social Security Trust Fund
Will Social Security still be around when you retire? Given data on the predicted balance of the social security fund over time, scholars plot the points on a coordinate grid and determine if a quadratic regression fits the data. They...
Concord Consortium
Function Project
What if a coordinate plane becomes a slope-intercept plane? What does the graph of a linear function look like? Learners explore these questions by graphing the y-intercept of a linear equation as a function of its slope. The result is a...
Mr. E. Science
Motion
An informative presentation covers motion, metric system, conversions, graphing of coordinates and lines, speed, velocity, and acceleration problems, as well as mean calculations. This is the first lesson in a 26-part series.
EngageNY
Matrix Multiplication and Addition
To commute or not to commute, that is the question. The 26th segment in a 32-segment lesson focuses on the effect of performing one transformation after another one. The pupils develop the procedure in order to multiply two 2 X 2...
Pennsylvania Department of Education
The Multiplicative Identity and Numbers Close to One
Pupils practice multiplying and dividing whole numbers by fractions. They study the multiplicative identity property that states that the product of any number and 1 is that number. They multiply whole numbers by fractions close to 1 and...


