Constitutional Rights Foundation
History of Immigration From the 1850s to the Present
The Statue of Liberty may embrace the huddled masses of the world, but has American society always joined in? After young historians read a passage about the history of American immigration in the 19th and 20th centuries, focusing on...
National Energy Education Development Project
Introduction to Solar Energy
People have been using solar energy for many generations to dry crops, heat homes, and for light. This presentation explains how now it is possible to capture the solar energy and store it for future use, details how and where people use...
Curated OER
Regents High School Examination: Living Environment 2009
Emerging ecologists need a full understanding of life, from the inner workings of a cell to the complex relationships among organisms. This examination is meant to assess high schoolers after an entire year course on the living...
Curated OER
Energy Worksheet #1
A graph of Earth's average monthly temperatures from 1990 to 1994 is posted across the top of the page for meteorology masters to analyze. Five multiple choice questions are asked regarding temperature variation. This does not have to be...
Curated OER
Canadian Social Trends
Students use surveys to explore how to design graphs, tables, and diagrams. They discuss articles which can stimulate ideas for research topics, or surveys of their own.
Curated OER
Reading Bar Graphs #2
Raise the bar in your third grade class with this learning exercise on bar graphs. Youngsters view three graphs representing three different sets of data, and answer questions based on what they analyze. The first set is completed as an...
Curated OER
Read My Bar Graph!
Elementary schoolers make and use bar graphs to picture information. They learn how choosing the right scale for a bar graph can help make a persuasive argument. This is a terrific lesson on graphing which should excite your kids. There...
Curated OER
How Soluble Is It?
Is sugar more soluble than salt? Experiment with water and solubility with an elementary science activity. After interpreting data from a bar chart, fifth graders use different types of sugar to determine if the size of sugar particles...
Curated OER
Terrestrial Ecosystem Response to Climate Change
An extensive investigation of the Earth's climate changes awaits your environmental science classes. This top-notch presentation begins by looking at the history of Earth's climate and then predicts the impact on each major terrestrial...
EngageNY
Two Graphing Stories
Can you graph your story? Keep your classes interested by challenging them to graph a scenario and interpret the meaning of an intersection. Be sure they paty attention to the detail of a graph, including intercepts, slope,...
Charleston School District
Sketching a Piecewise Function
How do you combine linear and nonlinear functions? You piece them together! The lesson begins by analyzing given linear piecewise functions and then introduces nonlinear parts. Then the process is reversed to create graphs from given...
California Academy of Science
California's Climate
The United States is a large country with many different climates. Graph and analyze temperature and rainfall data for Sacramento and Washington DC as you teach your class about the characteristics of Mediterranean climates. Discuss the...
Houghton Mifflin Harcourt
Nature Walk: English Language Development Lessons (Theme 2)
Walking in nature is the theme of a unit designed to support English language development lessons. Scholars look, write, speak, and move to explore topics such as camping, woodland animals, instruments, bodies of water, things found at a...
Inside Mathematics
Sorting Functions
Graph A goes with equation C, but table B. The short assessment task requires class members to match graphs with their corresponding tables, equations, and verbalized rules. Pupils then provide explanations on the process they used to...
Charleston School District
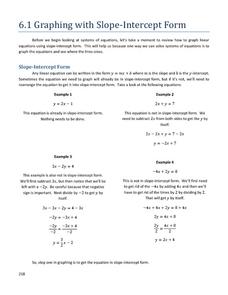
Graphing with Slope-Intercept Form
Work on graphing linear equations using the provided materials. The print and video lesson thoroughly review the concepts related to graphing linear equations in slope-intercept and standard form. The materials prepare learners for the...
Mathematics Assessment Project
Middle School Mathematics Test 3
Real-life mathematics is not as simple as repeating a set of steps; pupils must mentally go through a process to come to their conclusions. Teach learners to read, analyze, and create a plan for solving a problem situation. The provided...
Curated OER
Visual Literacy: Using Images to Increase Comprehension
A colorful PowerPoint is a great way to introduce the topic of visual literacy. The eye-catching presentation begins with an overview of visual literacy and then provides some specific strategies to help enhance reading comprehension. As...
Super Duper Publications
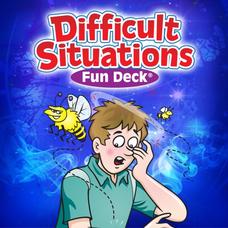
Difficult Situations Fun Deck
What would you do? Fifty-six illustrated picture flash cards provide players with an opportunity to talk about difficult situations, practice responses to awkward or uncomfortable situations, and consider how to deal with dangerous...
Curated OER
Graphing and the Coordinate Plane
Students examine the four quadrants of Cartesian coordinate plane. They play maze games and coordinate games to discover how to read and plot points on the plane. Students plot points on the coordinate plane and examine the ratio of...
Curated OER
Reading Graphs with a Logarithmic Scale
Guide high school meteorologists through a detailed examination of oxygen concentration data. The learners analyze a line graph containing logarithmic data and employ the use of a graphing calculator. A comprehensive worksheet and links...
Tech Know Teaching
5th Grade Constructed Response Question
New to constructed response question worksheets? Here's a model that demonstrates how to construct questions that require readers to interpret graphics found in informational text.
Curated OER
Drive the Data Derby
Three days of race car design and driving through the classroom while guessing probability could be a third graders dream. Learn to record car speed, distances traveled, and statistics by using calculation ranges using the mean, median,...
EngageNY
Interpreting, Integrating, and Sharing Information: Using Charts and Graphs about DDT
Is American growing fatter? Scholars begin with a mini lesson plan on reading charts and graphs using information about Human Body Fat in United States. They then transfer what they learned to charts and graphs using harmful and...
Curated OER
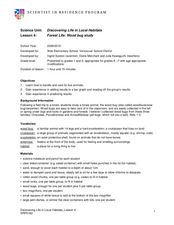
Forest Life- Wood Bug Study
Examine wood bugs and their habitat. Learners gather wood bugs and examine their bodies. Then discuss their body parts and how they help them survive. They also predict where they think wood bugs live to then graph the class results.


