Curated OER
Biological and Agricultural Engineering
Eighth graders explore mathematics by conducting a series of investigations using a colorimeter. In this math lesson, 8th graders explain the purpose of food irradiation. They collect data and graph them.
Curated OER
Median of a Trapezoid
Students find the median of trapezoids and other polygons. In this geometry instructional activity, students identify important properties of trapezoids. They create trapezoids and polygons using Cabri software.
Curated OER
8th Grade Math Properties
Eighth graders engage in a lesson that is concerned with the properties associated with 8th grade Algebra. They solve problems using a variety of contexts and participate in using real world problems to create context. Students...
Curated OER
Dueling Bumpers
Middle schoolers get an opportunity to show control of force and accuracy using a volleyball bump.
Curated OER
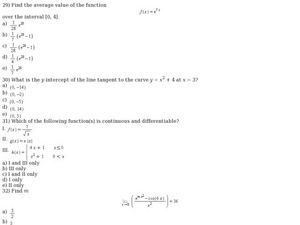
Sixteen Multiple Choice AP Calculus BC Exam Preparation Questions
In this review for Calculus BC exam instructional activity, students solve sixteen various multiple choice problems. These problems are designed as review and preparation for the AP Calculus Exam.
Curated OER
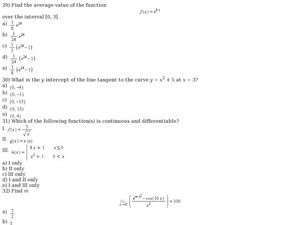
Converging Series
In this functions instructional activity, students calculate the average value, continuity, and the radius of convergence. There are 17 multiple choice questions.
Curated OER
Properties of a Parabola
In this algebra instructional activity, students identify the properties of a parabola. They factor and graph quadratic equations. There are 18 questions.
Curated OER
Surface Meteorological Observation System (SMOS)
Learners monitor local surface weather conditions for at least 30 days. They interpret the data by graphing it and detemining percentages.
Curated OER
Math & Social Science
Learners are given data and are to calculate averages and yearly totals of how many cars travel the Tacoma Narrows Bridge. They also make a graph of the data.


