Curated OER
Graphing : research and record information
First graders create graphs. In this graphing instructional activity, 1st graders create a floor graph using their bodies to record information. They create picture graphs after collecting information.
Curated OER
Integrating Social studies and the Visual Arts: "Learning to Look" Strategies
Students observe and interpret artwork through conducting a variety of activities. In this lesson students will learn how to analyze art work in order to gain a better understanding of it.
Curated OER
I Need More Information!
Students research a topic of their choice. In this researching lesson, students gather information and take notes about a topic they feel strongly about.
Curated OER
Introducing the Memo
Students explore memos to gather important information. For this memos lesson, students interpret memos and answer questions based on the information. Students define the parts of a memo. Students create their own memos.
Curated OER
How To Interpret a Document
In this history worksheet, students will learn how to interpret a historical document by completing a web with information about the document and it's audience and purpose.
University of North Carolina
Essay Exams
For decades, the sight of blue books has struck fear in the hearts of collegians. Those books usually signal an essay exam, the topic of one of the handouts in a larger series on specific writing assignments. Using the handout, writers...
Curated OER
From Quotation to Interpretation in Informational Texts
How to ignite thoughtful written responses with the words of philosophers, artists, and current events.
Learning Games Lab
Scientific Graph Reading
Interpreting graphs is an essential skill for young scientists. An interactive online lesson gives individuals an opportunity to review the components of a graph and learn to read and interpret the shape of a graph. The lesson includes...
Scholastic
Pilgrim and Wampanoag Daily Life for Grades 3-5
Thirteen steps make up a lesson that challenges pupils to compare and contrast the daily lives of Pilgrims and the Wampanoag tribe. Learners revisit the Graffiti Wall then break into small groups for an investigative reading assignment...
Newseum
Editorials and Opinion Articles
Reading the news is fun, and that's a fact! With the lesson plan, scholars differentiate between fact and opinion as they read editorial articles. They complete a worksheet to analyze the information before writing their own editorials...
Curated OER
Food for Class Party
In this interpreting a bar graph and math word problems worksheet, 2nd graders read the information about choices of food for a class party and answer various multiple choice questions. Students solve 25 problems.
Mathed Up!
Distance Time Graphs
If only there was a graph to show the distance traveled over a period of time. Given distance-time graphs, pupils read them to determine the answers to questions. Using the distance and time on a straight line, scholars calculate the...
Curated OER
Graphs: Students in Math Classes
Are your second and third graders just beginning to read bar graphs? This graph looks at the number of learners present in a math class Monday-Friday. Learners look for basic information, and the graph is easy to read.
Curated OER
Interpreting Paleoenvironments With Microfossils
Students gain a better understanding of how scientists can use foraminifera to interpret past environments. Specifically, students have the opportunity to explain one of the basic tenets of geology - the present is the key to the past.
Curated OER
Graphics Creation and Statistical Interpretation: Relating Local Economics and the Global Environment
Students apply statistics, and graphical interpretation to economics, the environment and populations. In this statistical lesson students construct graphical displays and classify data.
Curated OER
Interpreting Behavior: Expanding Our Point of View
Students study the importance of understanding behavior from the perspective of the culture in which that behavior is the norm. They determine that understanding another culture involves being able to interpret behaviors, customs,...
Curated OER
Seeing in 3D: Interpreting Two-Dimensional Diagrams of Three-Dimensional Objects
Students hone in on their skills at reading diagrams. In this dimensional lesson students collect information on the functions of organs then figure out how all the parts work together.
Curated OER
Fossil Fuels (III), The Geology of Coal: Interpreting Geologic History
Students hypothesize about why various samples of coal have different characteristics. Pupils use information that they found during Internet searches to ascertain the validity of their hypotheses and verify the "story" of coal. ...
Curated OER
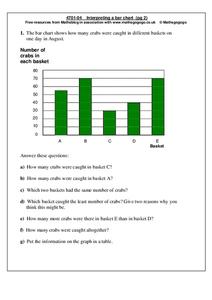
Interpreting a bar chart
In this bar chart worksheet, students analyze a bar chart and answer 7 questions pertaining to the information on the chart. The answers are on the second page.
Curated OER
Interpreting Line Graphs
Fifth graders interpret line graphs. In this graphing instructional activity, 5th graders first begin by reviewing the difference in bar and line graphs and what they are used for. Students practice interpreting the data on various line...
Curated OER
Mass: Applying and Interpreting
Students rotate through six studying stations solving problems that involve applying and interpreting aspects of mass. They solve various word problems, and measure the contents of cans and calculate the mass of two cans.
Curated OER
Graphs 2
In this graph practice worksheet, students examine a graph and use their problem solving skills on order to respond to 5 questions regarding the information presented on the graph.
Curated OER
Interpreting Graphs
For this algebra worksheet, students interpret graphs using given data and information. They are asked to relate real world scenario using algebraic equations. There are 31 questions with a variety of topics being covered.
Curated OER
Analyze and Interpret Statistical Information
In this probability and statistics activity, 9th graders analyze and interpret histograms as they identify trends in the data. The two page activity contains four problems. Answers are provided.


