Curated OER
Reading Graphs with a Logarithmic Scale
Guide high school meteorologists through a detailed examination of oxygen concentration data. The learners analyze a line graph containing logarithmic data and employ the use of a graphing calculator. A comprehensive worksheet and links...
US Department of Commerce
Looking at Numbers of Births Using a Line Graph
Was there a baby boom? Using census data, class members take a look at the number of 8-11 year olds and determine their birth years. Scholars create a double line graph to compare the number of births for two states for several years....
Mathematics Vision Project
Circles: A Geometric Perspective
Circles are the foundation of many geometric concepts and extensions - a point that is thoroughly driven home in this extensive unit. Fundamental properties of circles are investigated (including sector area, angle measure, and...
Science Matters
Finding the Epicenter
The epicenter is the point on the ground above the initial point of rupture. The 10th lesson in a series of 20 encourages scholars to learn to triangulate the epicenter of an earthquake based on the arrival times of p waves and s waves....
Curated OER
Graphs
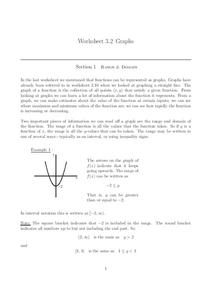
In this graphs worksheet, students solve and complete 15 various types of problems. First, they determine the range of the function of the graph shown and write in interval notation. Then, students find the domain of the function in the...
Alabama Learning Exchange
Wheels All Around
Budding mathematicians explore the concept of skip counting. They practice skip counting as they use it to determine the number of wheels that come to school at 3 different times throughout the day. They also create a data graph to show...
Curated OER
Forest Life- Wood Bug Study
Examine wood bugs and their habitat. Learners gather wood bugs and examine their bodies. Then discuss their body parts and how they help them survive. They also predict where they think wood bugs live to then graph the class results.
Curated OER
Location on a Grid
Make coordinate pairs more engaging by having beginners color-code a grid based on given locations. The grid has numbers along the y-axis and letters along the x-axis, introducing them to the ordering of coordinate pairs with the x-axis...
Curated OER
Timetable Problems
Learning how to read a schedule and determine when you will depart and arrive is an everyday skill that builds competency in chart reading, subtraction, elapsed time, and counting on. Learners discuss how to solve timetable problems and...
The Alamo
A Teacher’s Guide to Antonio LóPez De Santa Anna
Who was Antonio Lopez de Santa Anna, and how did he relate to the Texas Revolution? Use an informative resource to find out! By reading primary sources, viewing maps and graphs, and answering short-answer written prompts in handouts,...
Federal Reserve Bank
Lesson 4: Back to School
Based on your current level of human capital, how long would it take you to earn $1,000,000? What about your potential human capital? Learners explore the importance of education and experience when entering the workforce, and compare...
Curated OER
1, 2, 3, Read!
Explain to your readers a variety of decoding strategies to improve their reading fluency. They observe the teacher modeling blending, then in pairs take turns reading the book Clifford the Big Red Dog. Learners then time each other...
Alabama Learning Exchange
Tiger Math Graphing
Learners practice various skills using the book Tiger Math: Learning to Graph from a Baby Tiger. After listening to the story, they create a pictograph using data collected from the text. They also color a picture of a tiger, collect...
Polar Trec
How Much Data is Enough?
The next time you read a magazine or watch the news, make note of how many graphs you see because they are everywhere! Here, scholars collect, enter, and graph data using computers. The graphs are then analyzed to aid in discussion of...
Curated OER
Exploring Renewable Energy Through Graphs and Statistics
Ninth graders identify different sources of renewable and nonrenewable energy. In this math lesson, learners calculate their own carbon footprint based on the carbon dioxide they create daily. They use statistics to analyze data on power...
West Contra Costa Unified School District
Sneaking Up on Slope
Pupils determine the pattern in collinear points in order to determine the next point in a sequence. Using the definition of slope, they practice using the slope formula, and finish the activity with three different ways to determine the...
Curated OER
To stretch or not to stretch
Hands-on is the best way to play. Learners read a graph that shows the force needed to stretch a rubber band. They do this and then participate in a simple experiment where they create coiled springs with wire. They work to determine how...
Utah Education Network (UEN)
Linear Relationships: Tables, Equations, and Graphs
Pupils explore the concept of linear relationships. They discuss real-world examples of independent and dependent relationships. In addition, they use tables, graphs, and equations to represent linear relationships. They also use ordered...
Curated OER
Rockefeller's Revenge: Exxon and Mobil Unite
Study the impact and possible outcomes of the Exxon-Mobil merger in your language arts, social studies, or economics class. Secondary learners evaluate a series of graphs, write a paragraph interpreting the data, and engage in class...
Rainforest Alliance
Climate Educator Guide
Climate change is a hot topic in the news. Class members examine carbon dioxide data to analyze trends of our atmospheric makeup over time. They also discuss climate and climate change, and determine how these changes are affecting life...
Curated OER
Graph Mole
Practice graphing ordered pairs by playing an online graphing game. Learners will discover why it is useful to plot coordinates on a xy plane. Graph Mole, is the online game that allows them to practice through a fun, interactive story....
Curated OER
Simple Harmonic Motion
Back and forth, and back again. A presentation on harmonic motion would make a great backdrop for a directed instruction lesson in Honors Physics. It includes diagrams, formulas, graphs, and a few sample problems.
Curated OER
Great Graphing!
In these graphing worksheets, students learn to read graphs and answer questions by studying the graphs about the classroom pet, shirt colors, and breakfast food.
Curated OER
Canadian Social Trends
Students use surveys to explore how to design graphs, tables, and diagrams. They discuss articles which can stimulate ideas for research topics, or surveys of their own.


