Curated OER
How Much Water is Available in the Atmosphere for Precipitation?
Students explore the relationship between the amount of water in the atmosphere available for precipitation and the actual precipitation observed by satellite. They examine seasonal changes in precipitation. They practice using Internet...
Curated OER
Trends of Snow Cover and Temperature in Alaska
Students gather historical snow cover and temperature data from the MY NASA DATA Web site. They compare this data to data gathered using ground measurements from the ALISON Web site for Shageluk Lake. They graph both sets of data and...
Curated OER
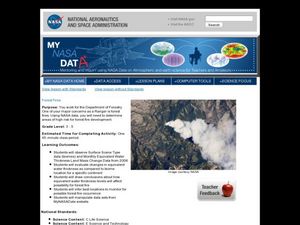
Forest Fires
Students play the role of a Ranger with the Department of Forestry. In this forest fires instructional activity, students examine data on biomes and images to determine high risk areas for forest fires to develop.
Curated OER
The Fabled Maine Winter
Students graph and analyze scientific data. In this research instructional activity students use the Internet to obtain data then draw conclusions about what they found.
NASA
Geographical Influences
"If global warming is real, why is it so cold?" Distinguishing the difference between weather and climate is important when it comes to understanding our planet. In these activities, young scientists look at the climate patterns in a...
Curated OER
Carbon Monoxide and Population Density
Tenth graders investigate the carbon monoxide level at a fixed latitude. They determine if there is a relationship to population density. They download data sets and generate a graph. They determine a link between human activity and...
Curated OER
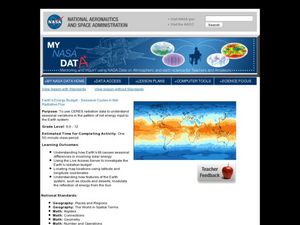
Earth's Energy Budget - Seasonal Cycles in Net Radiative Flux
Students attempt to understand seasonal variation by viewing images of the energy received by the earth. In this weather lesson, students view images from NASA of the influx of energy from the sun and make predictions about resulting...
Curated OER
Differences Between Ground and Air Temperatures
Students examine the differences between air temperature and ground temperature. For this investigative lesson students find NASA data on the Internet and use it to create a graph.
Curated OER
Comparing the Effects of El Nino and La Nina
Students examine the differences between an El Nino and La Nina year. In this investigative lesson students create maps and graphs of the data they obtained.
Curated OER
Exploring Photosynthesis with NASA Remote Sensing Data
Students explore photosynthesis using NASA satellite data. For this inquiry based biology lesson plan, students will look at data from a chosen national park to determine when the maximum amount of photosynthesis is occurring. This will...
Curated OER
Seasons and Cloud Cover, Are They Related?
Students use NASA satellite data to correlate cloud cover over Africa to the solar declination.
Curated OER
Evidence of Change Near the Arctic Circle
Students analyze graphs and make conclusions about climate change. In this climates lesson students produce graphs and identify relationships between parameters.
Curated OER
How Does the Earth's Energy Budget Relate to Polar Ice?
Students use satellite data to see how radiation budget relates to the ice that is present in the North. In this energy lesson students correlate data to see a relationship.
Curated OER
El Nino Lesson
Students compare graphs of weather occurrences. In this environmental lesson plan, students will being using the website to gather weather related information for a certain time period. The students will then graph the data that will be...
Curated OER
Human Effect
Learners investigate changes in air quality. For this science lesson, students compare data to determine the air quality. Learners explore how humans affect the air quality.
Curated OER
1492: Using Data to Explain a Journey
Young scholars examine how Christopher Columbus made his way across the Atlantic. In this data instructional activity students use an Internet program to navigate like Columbus.
Curated OER
Analysis of Atmospheric Conditions for a High Mountain Retreat
Students examine the relationship between altitude, atmospheric pressure, temperature and humidity at a particular location. They practice science and math in real world applications. They write reports detailing their scientific...
Curated OER
High Mountain Retreat
Students explore and analyze atmospheric conditions for a high mountain retreat. They examine the relationship between altitude, atmospheric pressure, temperature and humidity at a particular location. In addition, they write reports...
Curated OER
Ocean Currents and Sea Surface Temperature
Students use satellite data to explore sea surface temperature. They explore the relationship between the rotation of the Earth, the path of ocean current and air pressure centers. After studying maps of sea surface temperature and ocean...
Curated OER
Using Vegetation, Precipitation, and Surface Temperature to Study Climate Zones
Students begin their examination of the climate zones found around the world. Using a software program, they identify the relationship between the vegetation, climate and temperatures of the different zones. They also plot coordinates...
Curated OER
Hurricane Frequency and Intensity
High schoolers examine hurricanes. In this web-based meteorology lesson plan, students study the relationship between ocean temperature and hurricane intensity. They differentiate between intensity and frequency of hurricanes.
Curated OER
Snow Cover By Latitude
Students create graphs comparing the amount of snow cover along selected latitudes using data sets from a NASA website. They create a spreadsheet and a bar graph on the computer, and analyze the data.
Curated OER
Surface Air Temperature Trends of the Caribbean
Students investigate the seasonal changes to sea surface and near-surface air temperatures near the equator. They use actual satellite data to track and graph the differences in air and sea temperatures during different seasons in the...
Curated OER
Trends of Snow Cover and Temperature in Alaska
Students compare NASA satellite data observations with student surface measurements of snow cover and temperature. They practice data collection, data correlations, and making scientific predictions.


