Chicago Botanic Garden
Are Global CO2 Levels Changing?
According to the Mauna Loa observatory, carbon dioxide levels increased by 3 ppm in our atmosphere between 2015–2016. Individuals analyze carbon dioxide data from around the world and then share this with a home group in activity three...
Curated OER
From Playing with Electronics to Data Analysis
Learners collect and Analyze data. In this statistics lesson plan, students identify the line of best fit of the graph. They classify lines as having positive, negative and no correlation.
Curated OER
Box Plots
Young statisticians are introduced to box plots and quartiles. They use an activity and discussion with supplemental exercises to help them explore how data can be graphically represented.
Curated OER
Statistics and Shopping
Explore how statistics are used in everyday life. Your soon-to-be savvy consumers use the Internet to find consumer-related statistical information and learn to make wise consumer decisions. Includes links to a practice sheet about data...
Curated OER
What Color Are Your Skittles?
Students create spreadsheets and manipulate data. They collect data, create appropriate graphs and use percentages to describe quantities. Students compare and contrast data. They use spreadsheets to generate a pie chart.
University of Georgia
Freezing and Melting of Water
Examine the behavior of energy as water freezes and melts. An engaging activity provides a hands-on experience to learners. Collaborative groups collect data and analyze the graphs of the temperature of water as it freezes and then...
Virginia Department of Education
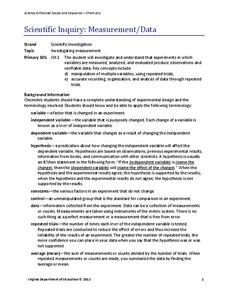
Scientific Inquiry: Measurement/Data
While pupils design their own lab experiments, they will not form a new species. Scholars take their materials and design an experiment regarding reaction rates.
TryEngineering
Data Representation: Millions of Colors
How many colors do you know? The lesson teaches scholars how digital devices use binary and hexadecimal representations to store colors. They learn how millions of colors are available on these devices.
EngageNY
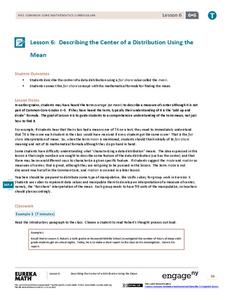
Describing the Center of a Distribution Using the Mean
Everyone does their fair share. The sixth segment in a 22-part unit presents the mean as a fair share. Groups build a conceptual understanding of the mean of a data set, rather than simply learn an algorithm. Learners use the...
Benjamin Franklin High School
Saxon Math: Algebra 2 (Section 3)
In this third of a twelve-part series, the focus moves from using matrices to solving systems of equations with substitution and elimination, including more than two dimensions and variables in equations, and analyzing statistical data....
Beyond Benign
Plastic Bags
Paper or plastic? Explore the environmental effects of using plastic bags through mathematics. Learners manipulate worldwide data on plastic bag consumption to draw conclusions.
Curated OER
Examine the Data
Seventh graders examine a teacher-created database and identify specific variables and develop hypothesis statements as to their possible effect. They create a summary statement either proving or disproving their hypothesis.
Curated OER
On the Trail of the Hudson's Migratory Fish
Using data related to the fish in the Hudson River area, learners calculate distance, elapsed time, and growth. They learn about migratory fish, the life cycle of a fish, analyze a map, and answer questions.
Curated OER
Exploring Wyoming Species Habitats
Students are introduced to the concept of species habitats and ranges. They introduced to ArcView GIS as a tool for mapping. Pupils use query data for species withina county, elevation, range, rivers and streams, land cover, and etc....
Curated OER
The Power of Graphical Display: How to Use Graphs to Justify a Position, Prove a Point, or Mislead the Viewer
Analyze different types of graphs with learners. They conduct a survey and determine the mean, median and mode. They then identify different techniques for collecting data.
Curated OER
Historical Population Changes in the US
Students conduct research on historical population changes in the U.S. They conduct Internet research on the Historical Census Data Browser, create a bar graph and data table using a spreadsheet program, and display and interpret their...
Curated OER
M & M Madness
M&M's are always a great manipulative to use when teaching math. In this graphing lesson plan, learners predict how many of each color of M & M's there are. They count up each color and plug the data into a graph using the...
Curated OER
Understanding the 1855 Census Database
Use data from the 1855 New York census to better understand the Irish immigrant experience during the late 19th century. Young historians analyze information from the census and build three hypotheses regarding the residents of the Five...
Howard Hughes Medical Institute
EarthViewer
Can you imagine Washington DC and London as close neighbors occupying the same continent? Learners will be fascinated as they step back in time and discover the evolution of the earth's continents and oceans from 4.5 billion years ago to...
Curated OER
Rate of Coral Growth
Using a table of information provided, middle school marine biologists chart data on a graph to determine the impact of water depth on coral growth in Australia's Great Barrier Reef. Then they answer questions that connect the data to...
Curated OER
Using Matrices for Data
In this matrices for data worksheet, 9th graders solve and complete 29 various types of problems that include using matrices to illustrate data. First, they determine the sum, difference and scalar product for each matrices shown. Then,...
Curated OER
Probability
Here is a classic activity used to introduce your class to the concept of probability and data collection. They will roll one die 30 times, then record and discuss the results. Great introduction, but too shallow to be considered a...
Noyce Foundation
Granny’s Balloon Trip
Take flight with a fun activity focused on graphing data on a coordinate plane. As learners study the data for Granny's hot-air balloon trip, including the time of day and the distance of the balloon from the ground, they practice...
University of Georgia
Using Freezing-Point Depression to Find Molecular Weight
Explore the mathematical relationship between a solvent and solute. Learners use technology to measure the cooling patterns of a solvent with varying concentrations of solute. Through an analysis of the data, pupils realize that the rate...


