Alabama Learning Exchange
Watch That Plant Grow
Middle schoolers examine the growth of marigolds in a greenhouse environment. They chart data in spreadsheets showing plant growth over time and under a number of conditions. They record measures of plant height and greenhouse temperature.
Curated OER
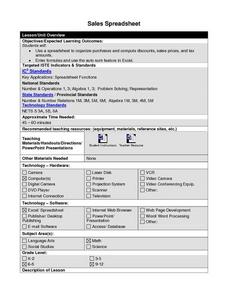
Sales Spreadsheet
Learners use Excel spreadsheets to organize purchases, discounts, sales prices, and sales tax. Students follow step by step instructions and enter formulas as well as use the auto sum feature to calculate required calculations.
Curated OER
Function Graphing--ID: 8252
Those graphing calculators can be tricky; good thing Texas Instruments has devised a lesson on how to use their TI-Nspire calculator to graph functions. Kids investigate functional notation as they graph ordered pairs in the form (a,...
Curated OER
Graphs and Spreadsheets
Students collect data and present it in a graph and/or a spreadsheet, depending on their previous understanding of technology.
Texas Instruments
Is It or Isn't It Proportional
How can you tell if number relationships are proportional? Mathematicians investigate proportional relationships. They compare and contrast functions and graphs to determine the characteristics of proportional relationships, as well as...
Curated OER
Level III: Technology Integration
Fourth graders prepare two spreadsheets each with an embedded line graph that displays data about the growth of the bitter rot fungus on apples and on petri dishes that were stored in the refrigerator and the classroom. They prepare a...
Code.org
Making Data Visualizations
Relax ... now visualize the data. Introduce pupils to creating charts from a single data set. Using chart tools included in spreadsheet programs class members create data visualizations that display data. The activity encourages...
Curated OER
Macbeth Madness
Students research Macbeth online and complete computer and graphing activities for the play. In this Macbeth activities lesson, students research Macbeth and bookmark the URL's. Students complete activities for the topic on spreadsheets...
Curated OER
Solving Polynomial Equations
Students demonstrate how to use spreadsheets as a tool for analyzing, visualizing and solving mathematical problems. Students obtain fundamental grasp of cubic equations and other polynomial equations.
Curated OER
Spreadsheet Function Machine
Students create a spreadsheet to analyze functions. In this algebra lesson, students use spreadsheets to find the intersection of systems of equations. They identify the dependent and independent function as it relates to a line.
Curated OER
Graphing Favorite Holidays
Students create spreadsheets and bar graphs based on results of survey of favorite holidays.
Curated OER
Finding Mean, Mode and Median in the Computer Lab
Students create spreadsheets which will display and figure mean, median, and mode of a set of numbers.
Curated OER
What Temperature Is It?
Young scholars use the internet to research information on the average maximum and minimum temperature for a city in their state. They create spreadsheets and enter data to analyze the information, focusing on averages, maximums,...
Curated OER
Touring the Regions of the United States
Fifth graders explore the regions of the United States. They use maps, research on the Internet and use measurements and estimations. Students create a presentation using spreadsheets and publishing software.
Curated OER
And the Survey Says...
Students use technology to input, retrieve, organize, manipulate, evaluate, and communicate information; apply appropriate technologies to critical thinking, creative expression, and decision-making skills. They collect and explore data...
Curated OER
Putting Your Money to Work
Students create a collect data on expenses. In this algebra lesson, students create a spreadsheet to solve scientific equations. They incorporate math, science and technology in this lesson.
Curated OER
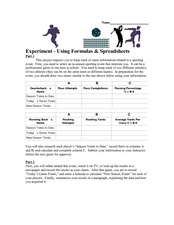
Experiment-Using Formulas and Spreadsheets
In this Algebra I worksheet, 9th graders track information relating to a sporting event and create a spreadsheet and appropriate formulas used to track data. The one page worksheet contains the assignment and instructions. Answers are...
Curated OER
Graphs! Graphs! Graphs!
Students practice making charts and graphs from data on spreadsheets. Individually, they create a graph representing the latest information on voter registration. They answer questions and analyze the data to end the lesson plan.
Curated OER
I'm in the Money - Practical Money Skills
Students make a budget and utilize math skills to keep a record of what they spend. They use technology and spreadsheets to help them keep track of their money.
Curated OER
Linear Regression (and Best Fit)
High schoolers explore notions of relationships between two variables. They use discussion, games, worksheets, spreadsheets to consider relationships such as: height vs. shoe size, cricket chirping vs. temperature.
Curated OER
Tiling a Patio
Fifth graders practice, with spreadsheets, to demonstrate how to determine the number of tiles needed to create a patio. They use pictures and gathered data to determine a pattern that can be used to solve problems. Students create a...
Curated OER
Class of 2000 - Student Loans
Students determine how they will finance their postsecondary education. In this student loan activity, students create spreadsheets that help them budget their first year of college. Students identify methods to fund the budgets and...
Curated OER
Electronic Spreadsheets & Iditarod 2000
Students use the Internet for gathering information for Iditarod race journals. They use a spreadsheet program for entering data and making charts for showing changes in speeds achieved over a period of four weeks in timed writings in...
Curated OER
Cars: Math, Research, Economics, Loans
Students investigate what the purchasing of a car entails. They explore car criteria and financing options.


