EngageNY
Modeling a Context from Data (part 1)
While creating models from data, pupils make decisions about precision. Exercises are provided that require linear, quadratic, or exponential models based upon the desired precision.
Mathed Up!
Stratified Sampling
Young mathematicians learn how to solve problems involving stratified sampling. They review concepts of sampling and proportionality by watching a video and then they complete a worksheet of questions on this topic.
Curated OER
Graphing
In this graphing instructional activity, students solve and graph 10 different problems that include determining various coordinates and the slope. First, they use the table to write the x and y coordinates for each point on the graphs....
Curated OER
The Shadow Knows: Student Worksheet
In this math worksheet, learners will work in small groups to measure the height of objects, such as trees, using their shadows. Students will be able to determine heights of objects that cannot be directly measured.
Curated OER
Scatter Plots
In this scatter plots worksheet, students solve and complete 6 different problems. First, they create a scatter plot to illustrate how weight and height are related and determine their relationship as positive, negative or no relation....
National Council of Teachers of Mathematics
Eruptions: Old Faithful Geyser
How long do we have to wait? Given several days of times between eruptions of Old Faithful, learners create a graphical representation for two days. Groups combine their data to determine an appropriate wait time between eruptions.
Illustrative Mathematics
Battery Charging
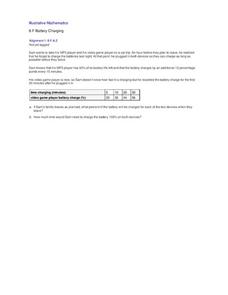
Your class will be very interested in the results of this activity. How long does it take a MP3 and video game player to charge? Sam only has an hour and the MP3 player only has 40% of its battery life left. Plus, his video player is...
California Education Partners
Animals of Rhomaar
Investigate the growth rates of alien animals. Pupils study fictional animals from another planet to determine how much they grow per year. The investigators plot the growth of their animals over a period of time and then compare them to...
Curated OER
High Five Board Game
For this high five board game worksheet, 8th graders use the game board and instructions provided to create ordered pairs using dice and cubes, then analyze the probability and predict outcomes.
Curated OER
Cost analysis
In this Algebra I worksheet, 9th graders analyze a problem in which basic assumptions must be made about cost and demand for the product or item. Students use a graph to make predictions and determine the best price at which to sell an...
Curated OER
Tearing a Piece of Paper in Half
In this secondary mathematics worksheet, students investigate exponential growth as they predict the height of a stack of paper formed by tearing one sheet of paper in half over and over again for thirty tears. The one page worksheet...
Curated OER
Exploring Exponential Models
Explore the difference between exponential growth and decay with this worksheet. Use tables, graphs, and algebraic methods to gain insight. The notion of an asymptote is also introduced.
Illustrative Mathematics
Extending the Definitions of Exponents, Variation 1
Scientist work with negative integer exponents all the time. Here, participants will learn how to relate negative exponents to time and to generate equivalent numerical expressions. Learners will apply the properties of integer exponents...
Curated OER
The Polar Bear Game
In this statistics learning exercise, students answer questions about the probability of an even occurring using dices. They keep tract of their data using a table and analyze the data to make predictions. There are 12 questions with no...
Virginia Department of Education
Linear Modeling
An inquiry-based algebra lesson explores real-world applications of linear functions. Scholars investigate four different situations that can be modeled by linear functions, identifying the rate of change, as well as the strength and...
Curated OER
Data Analysis
In this data analysis worksheet, 8th graders solve and complete 4 different problems that include determining the line of best fit for each. First, they write the prediction for an equation for each situation described. Then, students...
EngageNY
Writing and Evaluating Expressions—Exponents
Bring your young mathematicians into the fold. Scholars conduct an activity folding paper to see the relationship between the number of folds and the number of resulting layers in the 23rd installment of a 36-part module. The results of...
Noyce Foundation
Time to Get Clean
It's assessment time! Determine your young mathematicians' understanding of elapsed time with this brief, five-question quiz.
Curated OER
Scatter Plots
In this scatter plots worksheet, students solve and complete 4 different problems. First, they use the table shown to model the relation with a scatter plot and trend line and to predict the value of a variable when given the other...
EngageNY
The Graph of a Linear Equation in Two Variables
Add more points on the graph ... and it still remains a line! The 13th installment in a series of 33 leads the class to the understanding that the graph of linear equation is a line. Pupils find several solutions to a two-variable linear...
EngageNY
A Synthesis of Representations of Equivalent Ratio Collections
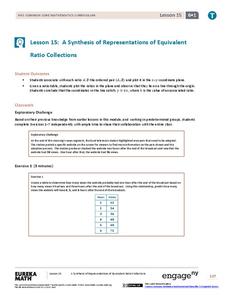
Make all the ratio representations fit together. The 15th segment in a series of 29 presents ratio problems to solve. Scholars use a variety of representations to respond to the questions. The problem set has pupils show how the...
Curated OER
Equation of a Line
In this equation of a line learning exercise, 9th graders solve and complete 4 different multiple choice problems. First, they use the median fit method to determine the equation that most likely represents the line of best fit for the...
Curated OER
Statistics
In this statistics instructional activity, students view 6 graphs to determine the correlation. Students then answer 4 questions that involve plotting data, determining a relationship, and making predictions.
EngageNY
Mid-Module Assessment Task: Grade 7 Mathematics Module 5
Determine the probability that the class knows probability. The three-question assessment presents problems with finding the sample space and the probability, theoretical and experimental, of a variety of situations. Pupils also describe...


