Inside Mathematics
Graphs (2006)
When told to describe a line, do your pupils list its color, length, and which side is high or low? Use a worksheet that engages scholars to properly label line graphs. It then requests two applied reasoning answers.
Noyce Foundation
Pizza Crusts
Enough stuffed crust to go around. Pupils calculate the area and perimeter of a variety of pizza shapes, including rectangular and circular. Individuals design rectangular pizzas with a given area to maximize the amount of crust and do...
Noyce Foundation
Sewing
Sew up your unit on operations with decimals using this assessment task. Young mathematicians use given rules to determine the amount of fabric they need to sew a pair of pants. They must also fill in a partially complete bill for...
EngageNY
Solving Percent Problems III
What happens when combining percentage discounts? The last lesson in a series of 29 introduces the idea of combining discounts one after another. Pupils wrestle with the claim that to find the total discount, they need to only add the...
Inside Mathematics
Quadratic (2009)
Functions require an input in order to get an output, which explains why the answer always has at least two parts. After only three multi-part questions, the teacher can analyze pupils' strengths and weaknesses when it comes to quadratic...
Virginia Department of Education
Nonlinear Systems of Equations
Explore nonlinear systems through graphs and algebra. High schoolers begin by examining the different types of quadratic functions and their possible intersections. They then use algebraic methods to solve systems containing various...
Curated OER
Counting the Stars in Draco
In this counting stars worksheet, students construct a histogram for stars in a given star field using their apparent magnitude. Students answer 5 questions using their tabulated data and histogram to answer questions about the stars of...
Curated OER
Bungee M&M's
Science is exciting - and delicious! Pairs of learners set up a bungee cord type of experiment. They use buckets filled with M & M's, a meter stick, and a Slinky spring (as the bungee) to conduct their experiment. A good activity...
Western Kentucky University
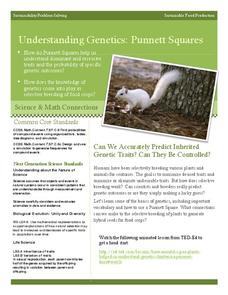
Understanding Genetics: Punnett Squares
Can scientists really predict genetic outcomes or are they simply making a lucky guess? Scholars first learn about Gregor Mendel and how to make Punnett squares. Then they extract DNA from a strawberry in a lab with included conclusion...
It's About Time
Coal and Your Community
When I was young, I was afraid of the dark. Now I am afraid of getting the electric bill. This fourth lesson in a series of eight focuses on coal mining, conservation, and energy efficiency. Scholars start by taking data from a table and...
Beyond Benign
Green"er" Precipitation Reaction
All sodium carbonate may not have the same amount of carbonate, but it should have the same percent. Learners write and balance an equation to predict the chemical reaction between sodium carbonate and zinc acetate. Through the lab...
Curated OER
Counting Squares
In this counting squares worksheet, students solve 2 problems that include counting 2 different sets of squares. First, they draw a picture of four squares arranged in two rows of two. Then, students determine the total number of squares...
Curated OER
Integration: Statistics, Scatter Plots and Best-Fit Lines
In this math worksheet, students identify the type (if any) of correlation on 6 scatter plots. They use information given on a table to create a scatter plot and identify the type of correlation. Students use the scatter plot to make...
Curated OER
Smarties Investigation
In this math worksheet, students complete a variety of activities using Smarties candy. For example, students estimate the number of each color, count the actual amount, and record their results in a tally chart.
Curated OER
Possible Outcomes 7
In this math worksheet, 6th graders make predictions about the possible outcomes for two word problems and correlate the data found in the graphic organizer.
Curated OER
Solving Algebraic Equations
In this algebraic equations worksheet, 6th graders solve and complete 9 different word problems that include various types of equations. First, they find consecutive even numbers and write an equation to solve. Then, students write a...
Curated OER
Graphing Ordered Pairs
Here is graphing worksheet which has pupils graph ordered pairs and label the axis. They graph five ordered pairs and then interpret the data in the graph.
EngageNY
More on Modeling Relationships with a Line
How do you create a residual plot? Work as a class and in small groups through the activity in order to learn how to build a residual plot. The activity builds upon previous learning on calculating residuals and serves as a precursor to...
Math Warehouse
Theoretical Probability Activity
If you keep rolling a die, you'll roll a five exactly one-sixth of the time—right? A probability lesson prompts young mathematicians to roll a die 100 times and use the data to calculate empirical probabilities. They then compare these...
Illustrative Mathematics
Kimi and Jordan
Kimi and Jordan have taken summer jobs to supplement their weekly allowances. Kimi earns more per hour than Jordan, but Jordan's weekly allowance is greater. This activity asks students to determine how the incomes of the two workers...
Stats Monkey
Everything I Ever Needed to Learn about AP Statistics I Learned from a Bag of M and M's®
Candy is always a good motivator! Use this collection of M&M's® experiments to introduce statistics topics, including mean, standard deviation, nonlinear transformation, and many more. The use of a hands-on model with these AP...
Utah Education Network (UEN)
Probability and Statistics
MAD about statistics? In the seventh chapter of an eight-part seventh-grade workbook series, learners develop probability models and use statistics to draw inferences. In addition, learners play games and conduct experiments to determine...
Ohio Literacy Resource Center
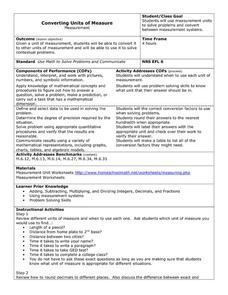
Converting Units of Measure
Follow six steps to implement this series of metric worksheets. Here, mathematicians exhibit their knowledge of problem solving, while converting units of measurement and label their answers with the applicable unit name.
Curated OER
Seized Before Flights: Graph
In this bar graph worksheet, students analyze a graph that show the number of prohibited items intercepted at U.S. airport screening checkpoints. Students answer 3 problem solving questions about the data on the graph.


