Curated OER
How Many?
Middle schoolers explore and design ways to collect data through simulations and random samples. They perform two experiments to determine the answers to various probability problems, and present the data/graphs in the form of a...
Curated OER
The Titanic 3
Can survival rates on the Titanic be explained by the "women and children first" policy or did rescue procedures favor the wealthy? Use actual historical data to explore conditional probability and independent events with your class....
Curated OER
Pizza! Pizza!
Third graders tally, sort, and organize pizza orders from monthly school sales. They create an advertising campaign to promote the School Pizza Sale, record the data in graph form, compare and contrast the tallies throughout the year,...
Statistics Education Web
Odd or Even? The Addition and Complement Principles of Probability
Odd or even—fifty-fifty chance? Pupils first conduct an experiment rolling a pair of dice to generate data in a probability lesson. It goes on to introduce mutually exclusive and non-mutually exclusive events, and how to use the Addition...
NASA
Revising an Investigation
Write, edit, and then revise! The fourth lesson in a five-part series asks peers to provide feedback on research. Individuals then use the research to edit and revise conclusions and develop their presentations.
Curated OER
Does the Sidewalk Drink Puddles?
Students participate in an experiment about evaporation. In this water cycle lesson, students use water, thermometers, and measuring tools to make a puddle and measure the size four times throughout the day. Students discuss their data...
Curated OER
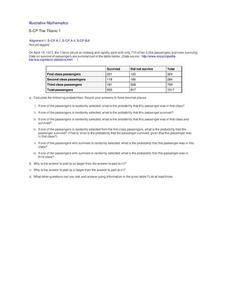
The Titanic 1
Were your chances of surviving the sinking of the Titanic better if you were a first-class passenger? Capture learners' attention with actual historical data to find the answer. They use two-way tables to calculate conditional and...
Curated OER
Fred's Fun Factory
Round and round and round she goes. Where she stops, nobody knows. This activity uses a common arcade game of chance, the spinning wheel, as a platform for computing expected values, interpreting results, and applying this knowledge to...
Curated OER
What Are The Chances
Students calculate the probability of an event occurring. In this probability instructional activity, students differentiate between independent, dependent or compound events. They find the range of the data.
Curated OER
Probability: The Study of Chance
Students practice the basic principles of probability by conducting an experiment, determining if a game is fair, collecting data, interpreting data, displaying data, conducting analysis, and stating and applying the rule for probability.
Curated OER
Scattered About
Students are introduced to the concept of scatter plots after reviewing the various types of graphs. In groups, they analyze the type of information one can receive from a scatter plot and identify the relationship between the x and y...
Curated OER
What's the Chance?
Students conduct probability experiments with dice and coins. They watch a video for a variety of situations where calculating the probability is complicated by total number of possibilities. They solve problems presented in the video.
Curated OER
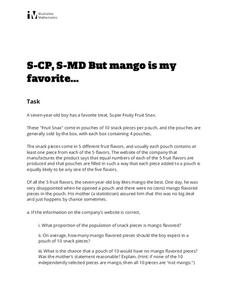
But mango is my favorite…
What are the chances of getting your favorite flavor in your fruit snack package? Have your class use the given information to compute their own experimental data using the multiplication rule of independent events and compare it to the...
Curated OER
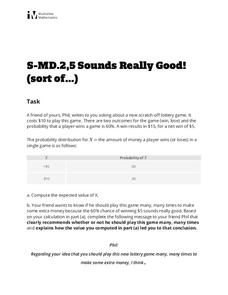
Sounds Really Good! (sort of...)
Your friend Phil wants to know if he should play the lottery. Have your class use the given data to compute the expected value and explain to Phil what he should do and why. This handout is ideal for a quick assessment of skill and...
Curated OER
Election Poll, Variation 2
When a random sample isn't enough, your math class can compare the data from a physical simulation to decide if the probability is still likely. The lesson is part of a probability series that focuses on one question and different ways...
EngageNY
Markup and Markdown Problems
There is a 100 percent chance this resource will help pupils connect percents to financial literacy. Young mathematicians use their knowledge of percents to find markups and markdowns in financial situations in the seventh segment in a...
Inside Mathematics
Archery
Put the better archer in a box. The performance task has pupils compare the performance of two archers using box-and-whisker plots. The resource includes sample responses that are useful in comparing individuals' work to others.
Inside Mathematics
Suzi's Company
The mean might not always be the best representation of the average. The assessment task has individuals determine the measures of center for the salaries of a company. They determine which of the three would be the best representation...
Curated OER
Escape The Hangman
Seventh graders investigate the concept of probability. They use the game of hangman to create engagement and context for conducting the lesson plan. They create a spreadsheet with data that is given. Students make predictions based on...
Curated OER
Rolling Dice
Fourth graders investigate the mathematical concept of probability. They determine the given mean of a data set found when rolling dice. The results of the experiment are displayed using a bar graph. The teacher does an example before...
Curated OER
Probability: the Study of Chance
Students experiment to determine if a game is fair, collect data, interpret data, display data, and state and apply the rule for probability. Students use a simple game for this experiment.
Curated OER
Exploring Probability
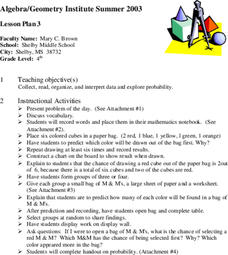
Fourth graders participate in a lesson that explores probability. They use candy and model cubes to experiment with different outcomes that can be charted if the students can proceed to the objective of the lesson. They discover how...
Curated OER
Matching Pairs
Young scholars examine the probability of the various findings in a game and determine the odds of winning. They differentiate between the facts of odds versus probability. Students use higher order thinking skills to explain how a...
Curated OER
Probability With a Random Drawing
Students define probability, and predict, record, and discuss outcomes from a random drawing, then identify most likely and least likely outcomes. They conduct a random drawing, record the data on a data chart, analyze the data, and...


