Curated OER
Is the Hudson River Too Salty to Drink?
In this estuary worksheet, learners examine data about the salinity of the Hudson River, create a graph from given data and complete 12 short answer questions about the data and graph.
Curated OER
Growth of a River
Students evaluate geography by drawing an image in class. In this river lesson, students identify a list of vocabulary terms associated with bodies of water. Students identify how a river is formed and draw a picture of one including the...
Curated OER
At the Edge of the Continent
Students study how to interpret a bathymetric map. They study the main features of the continental margin. They plot and graph bathymetric data. They think about and discuss the bathymetry of the edge of the cont
Curated OER
Water Density and Stability Lab
Students observe how different water densities and salinity control the depth at which different water masses occur. Submarines are used as a case study. This is a well-designed with an excellent worksheet.
Curated OER
SUBMARINE MOUNTAINS
Students create a two-dimensional contour map of a submerged area from a simulated survey using sounding techniques.
Curated OER
Wave Erosion Lesson
Fourth graders examine the effects of waves as they erode coastal land. They discover how the power of water can change the appearance of land formations.
Curated OER
Weather and Oceans: Uneven Heating of the Earth
Students investigate what causes the heat on Earth. In this Earth heating instructional activity, students experiment with different heat sources and determine where the Earth gathers the most heat. Students explore vocabulary words...
Curated OER
Birds
Young scholars list marine birds in their area and report on the threats made to these species. In this marine life lesson students compare bird count data and argue either for or against its accuracy.
Curated OER
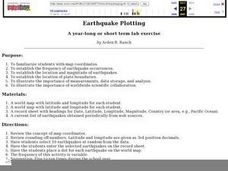
Earthquake Plotting
Learners become familiar with map coordinates. They establish the frequency of earthquake occurrences and study the location and magnitude of earthquakes. To establish the location of plate boundaries.
Curated OER
Jeannette
Pupils develop hypothesis about what might happen when salt water is frozen. In groups, they freeze ice samples with different salt concentrations. They use the internet to research the situation of the Jeannette to discover their answer.


