Curated OER
Exploration of 'pill bugs'
Fifth graders define words. They create a dichotomous key. After carefully examining pill bugs, 5th graders record observations. They compare and contrast habitats of pillbugs.
Curated OER
Drops on a Penny
A helpful worksheet describes an interesting demonstration on the surface tension of water. Learners guess how many drops of water the heads side of a penny will hold. This resource does a great job of describing just how a penny can...
Virginia Department of Education
Middle School Mathematics Vocabulary Word Wall Cards
Having a good working knowledge of math vocabulary is so important for learners as they progress through different levels of mathematical learning. Here is 125 pages worth of wonderfully constructed vocabulary and concept review cards....
Curated OER
US Airports, Assessment Variation
Determining relationships is all part of algebra and functions. Your mathematicians will decide the type of relationship between airports and population and translate what the slope and y-intercept represent. The problem is multiple...
Curated OER
Describing Data
Your learners will practice many ways of describing data using coordinate algebra in this unit written to address many Common Core State Standards. Simple examples of different ways to organize data are shared and then practice problems...
EngageNY
Buying a House
There's no place like home. Future home owners investigate the cost of buying a house in the 33rd installment of a 35-part module. They come to realize that the calculations are simply a variation of previous formulas involving car loans...
Curated OER
Point Comparisons
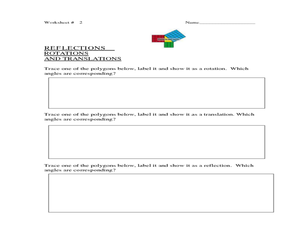
Young geometers investigate two-dimensional figures using coordinate grids. They identify polygons and draw examples of their reflection, rotation, and translation on a coordinate grid. And they complete a worksheet practicing examples...
American Statistical Association
An A-MAZE-ING Comparison
Teach your class how to use descriptive statistics through a hands-on data collection activity. Pupils collect their own data, calculate test statistics, and interpret the results in context. They compare male and female results, looking...
American Statistical Association
Colors Challenge!
Does writing the name of a color in a different colored ink affect one's ability to read it? Scholars design an experiment to answer this question. They collect the data, analyze the statistics, and draw a conclusion based on what they...
Statistics Education Web
Sampling in Archaeology
Compare different random sampling types using an archaeological setting. Scholars collect data from an archaeological plot using simple random samples, stratified random samples, systematic random samples, and cluster random samples....
Statistics Education Web
How High Can You Jump?
How high can your pupils jump? Learners design an experiment to answer this question. After collecting the data, they create box plots and scatter plots to analyze the data. To finish the instructional activity, they use the data to...
Shodor Education Foundation
InteGreat
Hands-on investigation of Riemann sums becomes possible without intensive arithmetic gymnastics with this interactive lesson plan. Learners manipulate online graphing tools to develop and test theories about right, left, and midpoint...
Achieve
BMI Calculations
Obesity is a worldwide concern. Using survey results, learners compare local BMI statistics to celebrity BMI statistics. Scholars create box plots of the data, make observations about the shape and spread of the data, and examine the...
Statistics Education Web
Consuming Cola
Caffeine affects your heart rate — or does it? Learners study experimental design while conducting their own experiment. They collect heart rate data after drinking a caffeinated beverage, create a box plot, and draw conclusions. They...
Statistics Education Web
Saga of Survival (Using Data about Donner Party to Illustrate Descriptive Statistics)
What did gender have to do with the survival rates of the Donner Party? Using comparative box plots, classes compare the ages of the survivors and nonsurvivors. Using the same method, individuals make conclusions about the gender and...
Curated OER
Graphs: All About Our Class
Students respond to survey questions, discuss results, brainstorm ways to represent survey information, and create table of class results. They find mean, range, and percentages, and create graph to display results.
Curated OER
Mean Absolute Deviation in Dot Plots
The lesson focuses on the ideas of dot plot representations and the mean absolute deviation of data sets.
Curated OER
The Way to Better Grades!
Pupils collect and analyze data. In this statistics lesson, learners create a scatter plot from their collected data. They use, tables and graphs to analyze the data and mae decisions.
Georgia Department of Education
The Basketball Star
Have learners use math to prove they are sports stars! Assess a pupil's ability to create and analyze data using a variety of graphs. The class will be motivated by the association of math and basketball data.
Curated OER
Aboriginal Statistics
Fourth graders analyze statistics of Native Americans by creating graphs. In this data analysis lesson, 4th graders define different statistical terms and practice finding those statistics from groups of numerical information about...
Curated OER
The Grapes of Math
Students "think" through mathematical problem solving and provide solutions using a variety of strategies after listening to Greg Tang's book, The Grapes of Math.
Curated OER
Deal or No Deal
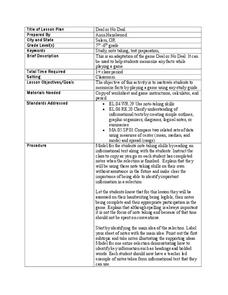
Young scholars play a game in order to memorize any set of facts. For this memorization lesson, young scholars play an adaptation of the game Deal or No Deal to help them review and memorize factual information. Young scholars also work...
Curated OER
The Spectrum of a Star
Tenth graders identify stars based on their line spectra. In this astronomy instructional activity, 10th graders analyze spectrograph and determine the elements present in the star. They explain the relationship between temperature and...
Curated OER
HEART THROBS
Students predict what might happen to their pulse rates after physical exertion and then make conclusions about the effects of physical activity on pulse rates.


