Curated OER
Analyzing Congruence Proofs
Looking at numerous examples of triangles, each with different properties, geometers develop their understanding of congruency. They use the notation of a counter-example to disprove certain conjectures and prove geometric theorems and...
Fuel the Brain
Brain Boosters-Money & Addition with Regrouping
If a leprechaun finds 39 cents, what are the possible coin combinations? A St. Patrick's Day math activity is a great way to keep the class excited about the holiday, but also keeps them focused on the math lesson too. By using addition...
Curated OER
Coin-cessions
In this counting coins practice worksheet, students use a menu to match equal item values with coin sets. Students are asked to choose items from the menu that total a given amount.
Curated OER
Coin-cessions II
In this counting coins practice worksheet, students use a menu to match equal item values with coin sets. Students are asked to choose items from the menu that total a given amount.
Curated OER
Introduction to Decimals
In this math worksheet, students are introduced to decimals by first studying pattern blocks showing a number with tens, ones and tenths. Students locate decimals on number lines and rulers and shade decimal pictures. Students compare...
Curated OER
Average Thanksgiving Dinners
In this math learning exercise, students read 4 story problems pertaining to Thanksgiving dinner. Students answer the multiple choice questions but do not do any actual calculations.
Curated OER
Consider the Possibilities
In this math instructional activity, learners analyze 4 story problems which have questions about possible outcomes. Students answer the questions which involve money, calendar and fractions.
Curated OER
Which is Impossible?
In this math worksheet, students solve 4 riddles in which 3 out of 4 answers shown could be correct. Students mark the answer that would be impossible.
Curated OER
Rounding Riddles
For this math worksheet, students solve seven riddles. Each riddle describes a number and involves rounding. Students round numbers in the riddle to find the solution.
Curated OER
More Rounding Riddles
In this math instructional activity, students use rounding skills to solve riddles. Each problem describes a secret number that students need to find by carefully following the clues.
Curated OER
Bar Graph- Calories In Fast Food Items
In this bar graph worksheet, students analyze a bar graph that shows calories in 10 fast food menu items. Students answer 7 questions about the graph.
Curated OER
Canadian Coins
In this money instructional activity, 2nd graders identify Canadian coins. Students complete 6 multiple choice questions using the drop down menu and select the correct name for each coin that is pictured.
Curated OER
Exponential Reflections
High Schoolers explore the concept of exponential reflections. They use their Ti-Nspire to reflect the natural logarithm function over the line y=x. Learners repeat the process using different exponential functions using a slider.
Curated OER
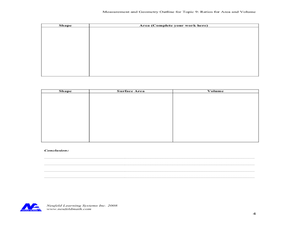
Ratios for Area and Volume
In this ratios for area and volume worksheet, students solve problems where they find the ratios for problems of shapes dealing with area and volume. Students complete 4 problems.
Curated OER
Concept: Dependent Events
Middle and high schoolers determine the probability of dependent events. Students compute both compound and simple probability. This four-page worksheet contains six multi-step problems.
Neufeld Learning Systems
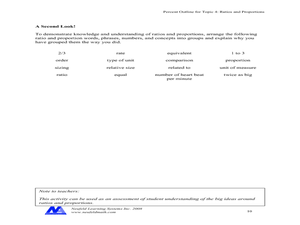
Concept: Ratios and Proportions
Upper elementary and middle school pupils fill out a chart creating six equivalent fractions and then compare them to six different objects and/or shapes. They group together 16 various terms related to ratios and proportions. Pupils...
PBS
Working with Coordinate Planes: Activities and Supplemental Materials
Seven activities make up a collection of supplemental materials to reinforce graphing on a coordinate plane. Worksheet objectives include plotting coordinates within single and four quadrants, measuring straight and diagonal lines, and...
Piscataway Township Schools
Bake Sale
Here is a project that instructs young bakers to calculate the ingredients needed for a cookie bake sale. The catch is that the ingredients for 32 cookies is given; however, pupils must figure out the amounts needed for 12 and 60...
Saxon
Plotting Functions
Youngsters use a graphing calculator to assist in creating a function table. They graph the function on a coordinate plane. They explore the relationship between the domain and range in the graph. This four-page worksheet contains two...
PBS
Working with Common Denominators: Activities and Supplemental Materials
Enjoy these straightforward and simple worksheet pages that practice with different denominators. The practice starts simple with adding fractions together and then works on a recipe that needs to be tripled.
Mathematics Assessment Project
Taxi Cabs
A simple real-world problem involving taxi cab fares is used to practice the multplicaiton and division of integers. How many of two different-sized taxis are needed to transport 75 people to the airport? What is the least expensive...
Curated OER
Representing Data 1: Using Frequency Graphs
Here is a activity that focuses on the use of frequency graphs to identify a range of measures and makes sense of data in a real-world context as well as constructing frequency graphs given information about the mean, median, and range...
Curated OER
Representing Data 2: Using Box Plots
What information can be gleaned from a box and whiskers plot? Discuss the five summary values - minimum, maximum, upper and lower quartiles, and median - and what conclusions can be made from these values? Included here is a matching...
Mathematics Assessment Project
Representing Polynomials
Use this complete and very detailed lesson plan to assess your learners' understanding of two important behaviors of polynomials. The first is the relationship between the zeros of a polynomial function and the function's graph, and the...
Other popular searches
- Restaurant Menu Math
- Hamburger Hut Menu Math
- Thanksgiving Menu Math
- Menu Math Activity
- Hamberger Hut Menu Math
- Real Life Menu Math
- Menu Math Lessons
- Menu Math Worksheet
- Math Menu Project
- Math Menu Word Problems
- Menu Math Lesson Plans
- Math Menu


