Curated OER
Basic Excel
Students explore basic Excel spreadsheets. In this spreadsheet lesson plan, students enter Alaska weather information and perform calculations. Students title the columns on the spreadsheet and format the cells. Students complete...
Curated OER
Excel Lesson
Young scholars investigate Microsoft excel. In this technology lesson, students create formulas using excel and apply these formulas to solve relative, absolute and mixed reference cells. They perform immediate and delayed calculations.
Curated OER
Basic Algebra and Computers: Spreadsheets, Charts, and Simple Line Graphs
Young scholars, while in the computer lab, assess how to use Microsoft Excel as a "graphing calculator." They view visual representations of line graphs in a Cartesian plane while incorporating basic skills for using Excel productively.
Curated OER
Let's Get Linear
Math whizzes utilize spreadsheets to examine linear modeling. They roll marbles down a ramp from three different heights and measure how far they roll. They use Excel to record their data and create a plot of their data.
Earth Watch Institute
Entering Local Groundhog Data in an Excel Spreadsheet
Here is a cross-curricular ecology and technology lesson; your learners create spreadsheets depicting the location and number of groundhog dens in a local park. They research groundhogs and analyze data about where the groundhog...
Curated OER
Conversation Heart Graphing
Sixth graders review the different types of graphs (bar, line, pictograph) They predict the data set they can garner several boxes of conversation hearts. Students record their data using an Excel spreadsheet. They create a graph based...
Curated OER
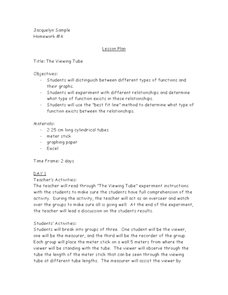
The Viewing Tube
Looking for an excellent lesson that incorporates math, science, and technology? Groups of three students use a viewing tube to perform an experiment, and discover how to organize their data into an Excel spreadsheet. This is a very...
Curated OER
Graphically Speaking
Students discover the links between population and Congressional representation. In this government lesson, students research population statistics and create spreadsheets that compare population to the number of Congress members per state.
Curated OER
Dental Detectives
First graders explore the theme of dental health and hygeine. They make tooth loss predictions, count lost teeth, and graph tooth loss. In addition, they listen to dental health stories, read online stories, create spreadsheets, and play...
Curated OER
A Comparison Study of Water Vapor Data to Precipitation over North America
Students use NASA satellite data to compare water vapor over the United States. For this data analysis lesson students use an Excel spreadsheet to map their data.
Council for Economic Education
Loan Amortization - Mortgage
When you buy a home for $100,000, you pay $100,000—right? On the list of important things for individuals to understand, the lesson plan presents the concept of interest rates and loan amortization using spreadsheets and online sources....
Curated OER
What Color Are Your Skittles?
Students create spreadsheets and manipulate data. They collect data, create appropriate graphs and use percentages to describe quantities. Students compare and contrast data. They use spreadsheets to generate a pie chart.
Curated OER
Money Math: Lessons for Life
Students develop a budget for a college student using all of the influences that the student would have. In this budgeting lesson plan, students use real life examples to create a budget spreadsheet. Students read and study sample...
Curated OER
Don't Settle for a Byte... Get the Megabyte on Technology
Students use word processing, presentation, and spreadsheet software. In this multi-day computer software usage lesson, students complete a research project that requires the use of a word processor, Excel, FrontPage, and PowerPoint to...
Curated OER
Creating Climographs
Young scholars use satellite data to compare precipitation and surface temperatures on different islands. In this satellite instructional activity students create graphs and explain the differences between weather and climate.
Curated OER
Great Graphing
Students collect data, use a computer spreadsheet program to create various graphs, and compare the graphs. They state the findings of each graph in writing and decide which graph type best represents the data.
Curated OER
Let's Keep Track of Grades
Students participate in a technology project. This instructional activity is a hands-on spreadsheet project where students are responsible for keeping track of their grades for class. The students learn to enter data into a...
Curated OER
Pumped Up Gas Prices
Students calculate gas prices. In this transportation lesson plan, students tally the mileage and gas costs of their car for one months. They figure out how much was spent on gas and create a graph showing average gas prices over time.


