Mathalicious
XBOX Xpotential
Touchdown! This is an exponentially insightful lesson that explores the growth of football games with different video game consoles. Class members discuss whether the increase of mergahertz can be described as linear or exponential. The...
Virginia Department of Education
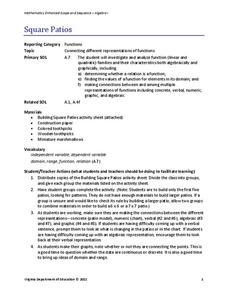
Square Patios
Build a patio from toothpicks and marshmallows to analyze functions! Learners look for patterns in the data as they create different size patios. As they discover patterns, they make connections between the different representations of...
Curated OER
Matchstick Math: Using Manipulatives to Model Linear, Quadratic, and Exponential Functions
Playing with matches (unlit, of course) becomes an engaging learning experience in this fun instructional unit. Teach pupils how to apply properties of exponential functions to solve problems. They differentiate between quadratic and...
NASA
Space Shuttle Ascent: Altitude vs. Time
How long did it take to get to that altitude? Using a Google Earth file, groups explore a space shuttle launch. Using a calculator, groups determine the function that models the altitude/time data from an actual launch. With the model in...
EngageNY
Modeling a Context from a Verbal Description (part 1)
When complicated algebraic expressions are involved, it is sometimes easier to use a table or graph to model a context. The exercises in this lesson plan are designed for business applications and require complex algebraic expressions.
PBL Pathways
Students and Teachers 2
Examine trends in student-to-teacher ratios over time. Building from the first task in the two-part series, classes now explore the pattern of student-to-teacher ratios using a non-linear function. After trying to connect the pattern to...
Curated OER
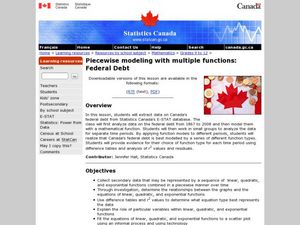
Piecewise Modeling with Multiple Functions: Federal Debt
Students analyze data on debt and write an equation. In this statistics instructional activity, students are given data from different time periods, and are asked to graph and analyze the data. They work in groups, and are assigned...
Achieve
Ivy Smith Grows Up
Babies grow at an incredible rate! Demonstrate how to model growth using a linear function. Learners build the function from two data points, and then use the function to make predictions.
101 Questions
Penny Circle
Watch as your classes buy into a rich lesson full of information. A video opener challenges individuals to determine the number of pennies that fit in a circle with a 22-inch diameter. Using lesson materials, scholars collect data and...
Concord Consortium
Broken Spreadsheet I
There is power in spreadsheet formulas and learners use this power to model quadratic data. Given a scatterplot of a parabola, pupils create formulas in a spreadsheet to populate the data. The formulas they use lead to an understanding...
EngageNY
Modeling with Polynomials—An Introduction (part 2)
Linear, quadratic, and now cubic functions can model real-life patterns. High schoolers create cubic regression equations to model different scenarios. They then use the regression equations to make predictions.
Inside Mathematics
Quadratic (2009)
Functions require an input in order to get an output, which explains why the answer always has at least two parts. After only three multi-part questions, the teacher can analyze pupils' strengths and weaknesses when it comes to quadratic...
Inside Mathematics
Snakes
Get a line on the snakes. The assessment task requires the class to determine the species of unknown snakes based upon collected data. Individuals analyze two scatter plots and determine the most likely species for five additional data...
Curated OER
Logistic Growth Model, Explicit Version
Via the concrete setting of estimating the population of the US, your algebra learners are introduced to a logistic growth model. Comparing and contrasting logistic, exponential, linear and quadratic models, to see which fits the data...
NASA
Weightless Wonder
A video of the weightless wonder provides a setting for the math to follow. Groups analyze the graph of a quadratic function that models the path of the C-9 as it gives astronauts the experience of weightlessness. Using a graphing...
Mathalicious
Domino Effect
Carryout the lesson to determine the cost of pizza toppings from a Domino's Pizza® website while creating a linear model. Learners look through real data—and even create their own pizza—to determine the cost of each topping. They explore...
Balanced Assessment
Books from Andonov
To examine mathematical functions in a modeling situation pupils combine quadratic and step functions to represent a presented scenario. They both graph and write a function to represent data shown in a table.
Curated OER
Collecting And Fitting Quadratic Data
Students investigate the concept of using quadratic data to plot coordinates on a plane. They also apply the quadratic formula for a variety of problems with the help of a graphing calculator to draw the parabola for given coordinates.
Howard County Schools
Planning for Prom
Make the most of your prom—with math! Pupils write and use a quadratic model to determine the optimal price of prom tickets. After determining the costs associated with the event, learners use a graph to analyze the break even point(s).
Curated OER
Modeling the Keeling Curve with Excel
In this modeling the Keeling Curve worksheet, learners use given data beginning in 1960 to create a mathematical model for the changes in atmospheric carbon dioxide over time. Students manipulate the equation to predict the carbon...
EngageNY
Relationships Between Two Numerical Variables
Is there another way to view whether the data is linear or not? Class members work alone and in pairs to create scatter plots in order to determine whether there is a linear pattern or not. The exit ticket provides a quick way to...
Curated OER
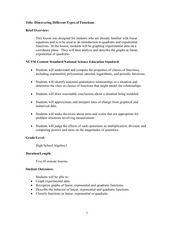
Discovering Different Types of Functions
Graph polynomials and identify the end behavior of each polynomial function. The class differentiates between linear, quadratic, and other polynomial equations.
Curated OER
Graphs and Functions
Use this series of activities to introduce learners to graphing functions. They graph both linear and quadratic equations by hand and with a Graph Sketcher Tool. Several imbedded links and handouts are included in the instructional...
Curated OER
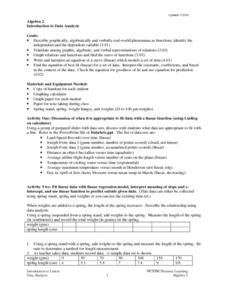
Introduction To Data Analysis
Seventh graders investigate the concept of looking at the data put in a variety of ways that could include graphs or data sets. They analyze data critically in order to formulate some sound conclusions based on real data. Students graph...


