Curated OER
Comparison of Snow Cover on Different Continents
Students use the Live Access Server (LAS) to form maps and a numerical text file of snow cover for each continent on a particular date and analyze the data for each map, corresponding text file to determine an estimate of snow cover for...
Curated OER
Differences Between Ground and Air Temperatures
Students examine the differences between air temperature and ground temperature. In this investigative lesson students find NASA data on the Internet and use it to create a graph.
Curated OER
Think GREEN - Utilizing Renewable Solar Energy
Students use data to find the best renewable energy potential. In this solar energy lesson students import data into Excel and explain how solar energy is beneficial.
Curated OER
Amelia the Pigeon: As a Pigeon Flies
Students follow Amelia's adventure on a satellite image. They use measuring and math skills to determine the distance she traveled.
National Wildlife Federation
I’ve Got the POWER! Solar Energy Potential at Your School
Should every school have solar panels? The 19th lesson in a series of 21 has scholars research the feasibility of using solar panels at their school. They begin by gathering data on the solar energy in the area before estimating the...
Curated OER
Light Travel Times
In this travel time of light worksheet, students read about the NASA satellites and space probes that transmit radio signals at the speed of light across huge distances. Students solve 3 problems about data transmission from space to...
Curated OER
Satellites and the Radiation Budget
Students engage in a prelab discussion about the earth's radiation budget and global warming. They use "trading cards" to find specific websites to research radiation budget questions.
Curated OER
Solar Cell Energy Availability From Around the Country
Students determine areas that are the most likely to produce solar energy by using NASA data. In this solar energy lesson students analyze plots and determine solar panel use.
Curated OER
Analyzing Tree Rings to Determine Climate Change
Students examine how to locate and access data sets. In this climate change lesson students import data into Excel and graph it.
Curated OER
Does cloud type affect rainfall?
Student use MY NASA DATA to obtain precipitation and cloud type data. They create graphs of data within MY NASA DATA. Students compare different cloud types, compare precipitation, and cloud type data They qualitatively describe graphs...
Curated OER
Comparing the Effects of El Nino and La Nina
Students examine the differences between an El Nino and La Nina year. For this investigative lesson students create maps and graphs of the data they obtained.
Curated OER
Hurricanes As Heat Engines
Students examine sea surface temperatures to see how hurricanes get heat from the oceans surface. In this hurricanes lesson plan students use the Internet to find data and make line plots.
Curated OER
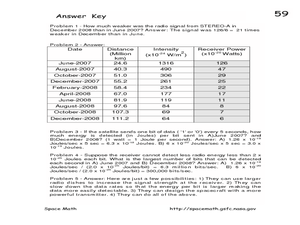
The STEREO Mission: Getting The Message Across
In this STEREO satellites instructional activity, students are given a chart with the intensity of the signals from the satellites received on Earth and the distances of the satellite from Earth. Students convert the intensity at each...
Curated OER
Message in a Bottle - A Satellite Journey through the Gulf Stream
The Gulf Stream has historically provided humans with a faster trade route because of its swift-moving waters. It continues to be a source of information and fascination for oceanographers today. As your class views this collection of...
NASA
Hurricanes and Hot Towers with TRMM
Take cover because a wild presentation on hurricanes is about to make landfall in your classroom! An outstanding PowerPoint presentation is the centerpiece of this lesson. Not only does it provide information and photographs, but several...
National Wildlife Federation
I Speak for the Polar Bears!
Climate change and weather extremes impact every species, but this instructional activity focuses on how these changes effect polar bears. After learning about the animal, scholars create maps of snow-ice coverage and examine the yearly...
NASA
Down to Earth
There are only 10 types of people in the world: those who understand binary and those who don't. The lesson includes four activities in which students learn binary, convert binary to images, understand CCD arrays, and interpret...
Curated OER
Time That Period
Physical science starters play with a pendulum in order to experience periodicity. Detailed procedures and a worksheet are included for day one. For day two, learners will use a graphing calculator to help them plot orbit data from a...
Curated OER
March of the Polar Bears: Global Change, Sea Ice, and Wildlife Migration
Learners study global change and how these changes impact wildlife. In this polar bears lesson students analyze maps and data to understand climate change.
Curated OER
Ocean Currents and Sea Surface Temperature
Students use satellite data to explore sea surface temperature. They explore the relationship between the rotation of the Earth, the path of ocean current and air pressure centers. After studying maps of sea surface temperature and ocean...
Curated OER
Aruba Cloud Cover Measured by Satellite
Students analyze cloud cover and compose written conclusions to a given related scenario. Students submit a letter of response and a report detailing their calculations and conclusions.
University of Colorado
Spacecraft Speed
Space shuttles traveled around Earth at a speed of 17,500 miles per hour, way faster than trains, planes, or automobiles travel! In the 13th installment of 22, groups graph different speeds to show how quickly spacecraft move through...
Curated OER
Stars and Slopes
More of a math lesson plan than physics or space science, high schoolers take a set of data and plot it on a log-log coordinate system. The write-up for day two was never completed, but day one, "Stars and Slopes," is complex and...
Curated OER
El Nino Lesson
Students compare graphs of weather occurrences. In this environmental lesson plan, students will being using the website to gather weather related information for a certain time period. The students will then graph the data that will be...


