Curated OER
Popcorn Nutrition
Students read a snack nutrition chart and answer questions. They compare nutrition levels of snack foods. They correctly calculate differences in nutritional value.
Curated OER
Lesson 1: Fast Food Nutrients
Students compute the nutrient values of fast foods. In this fast food nutrient, students observe a PowerPoint about nutrition. They research nutritional topics, answer questions about nutrition, and determine the nutrient values of...
Curated OER
You Are What You Eat (Grades 5-8)
Students gain an enhanced understanding of the relationship between proper nutrition and good health. Through use of video, hands-on activities and interaction, students measure energy in food, and recognize sources of vitamins and...
Curated OER
Computation: How can we use rice to solve problem questions?
Fourth graders graph metric tons of rice produced by various countries. In this graphing lesson, 4th graders follow problem solving steps to answer questions about rice nutrition and then graph the amount of rice produced by several...
Curated OER
Making Molecular Models
In these creative hands-on activities, students construct several different molecular models that represent substances that play an essential role in our nutritional needs. Using gum drops and toothpicks, students design the models....
Curated OER
The Food Guide Pyramid
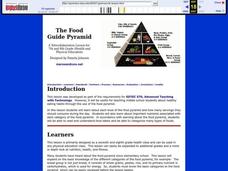
Students examine each level of the food pyramid and how many servings they should consume during the day. They study the important nutrients associated with each category of the food pyramid.
Curated OER
It's Sugar Time!
Fifth graders examine how good health depends upon many things, including heredity, lifestyle, personality traits, mental health, attitudes, and the environment.
Curated OER
Nine Examples for Tables, Pictographs, Mean. Median, and Mode
In this graphical representation of data and measures of central tendency worksheet, students calculate mean, median, and mode and answer questions related to graphs, tables, and pictographs.


