Curated OER
Our Pets
In this graphing worksheet, students survey their classmates about what pets they like. Students record the data in the form of a bar graph. There are 8 choices listed.
Curated OER
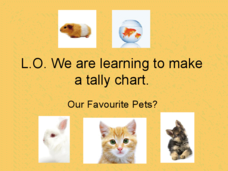
Pet Tally
Give the class an opportunity to practice using tally marks as a way to collect data. As you progress through the slide show, learners tally up the number and types of pets they see, they then use their data to create a tally chart....
Curated OER
Math--Pictures and Bars--Learning About Graphs
What is a graph? What does it tell us? How do you make one? These are all questions that are answered in the included packet. It's a great introduction to graphing for young learners!
Curated OER
Graphing
Intended for a faith-based classroom, this lesson requires second graders to create a survey, conduct the survey in multiple classrooms, and graph the results. They can choose between creating a picture or bar graph, or you can require...
Curated OER
Data Collection
Students write a journal exercise that relates to pets. They collect information from each other in order to practice making and interpreting bar graphs. They Continue building different kinds of graphs with the group.
Curated OER
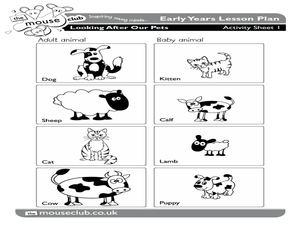
Looking After Our Pets
Students explore animal lifestyles by illustrating images. In this pet care lesson, students discuss their own pets and the conditions animals need to survive in both nature or a home. Students draw snakes and complete an activity sheet...
Curated OER
Graphing Statistics & Opinions About Pets
Students explore how to use a double bar graph by polling other students about their feelings and experiences with pets. They also have the opportunity to think about how pets affect their lives. Students poll their classmates to find...
Curated OER
All About Graphs
Students practice organizing data by creating graphs. In this statistics instructional activity, students survey the class about favorite colors and create a bar graph using the data. Students complete a test based on pet and animal...
Curated OER
Pets: Stuffed Animal Day
Students bring in their favorite stuffed animals to class, and listen to the book, The Perfect Pet. They develop graphs for their stuffed animals, and create booklets titled, My Pet Book.
Curated OER
Pets - Stuffed Animal Day
Students listen to Courtney Baker's, "The Perfect Pet," on a day they bring a stuffed animal to school. They graph the types of stuffed animals that their classmates brought to school before answering questions based on the graph. Next,...
Curated OER
Our Favorite Pet
Students each have a turn, telling the class his or her favorite pet. The choices are cat, dog, fish or bird. Using the computer, the information from the tally be recorded on a spreadsheet and bar graph.
Curated OER
Responsibility: Caring for Classroom Virtual Pets
Students define the term "responsibility". As a class, they participate in voting on different ideas presented to them and develop a graph showing the results. They use the internet to virtually take care of the adopted pet of the class.
Curated OER
Our Animal Friends
Students use the internet to find information pertaining to the benefits of pets. They list their results on a database. They find and record data on the percent of households that own pets as well as the top six species of pets. Once...
Curated OER
LIONS and TIGERS and BEARS. . .Oh My! Animals of Connecticut and the World
Students identify and list the different types of pets owned by the children in the class.
They graph the total number of each type of pet owned. They draw or cut-out a picture of an animal. Using the materials listed above, the children...
Curated OER
LD50 of NaCl to Gammarus spp.
Students learn the meaning of LD50 through lecture and discussion. Through experiment, students graph and calculate the LD50 of salt on fresh water amphipods. Students compare results of the experiment with pesticides and pollutants.
Curated OER
Life Processes and Living Things-Humans and Other Animals
In this fill in the blank worksheet, students respond to 20 short answer questions by identifying foods that contain large amounts of sugar, carbohydrate, and fruit acids and explaining their effects on the body.
Curated OER
Around the World
Students explore ways people from around the world are like them. They discuss how geography affects the way people live and work and how culture affects a person's day to day life. Students give a presentation over a chosen country to...
Curated OER
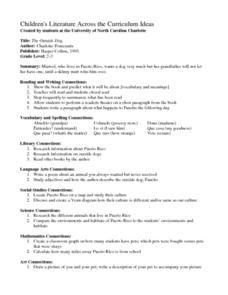
The Outside Dog
Students observe the book, "The Outside Dog," and predict the events of the story. At the conclusion of the story, students act out various paragraphs from the book and write about specified characters. Additional cross-curriculum...
Curated OER
A Science Experiment With Crayfish
A crayfish can lead to a science experiment involving habitats, animal behavior, and anatomy..
Curated OER
Investigations into Estimations
Learners gain the powerful tools of estimation, prediction, and averaging and discover the importance these tools have in daily living.


