Curated OER
The Cuneiform Writing System in Ancient Mesopotamia: Emergence and Evolution
Students research the parallel development and complexity of writing and civilization in ancient Mesopotamia. In this ancient Mesopotamia instructional activity, students analyze the Cuneiform writing system in ancient Mesopotamia and...
Curated OER
Smarties Pictogram and Bar Chart
For this math worksheet, students create a bar chart to illustrate the number of Smarties they have in each color. Students also draw a pictogram to represent the same information.
Curated OER
Write From the Beginning
Students discuss the earliest form of writing, pictographs and view several examples. They then create their own hieroglyphics and write a short story using them. They then create and label a timeline including methods of writing prior...
Curated OER
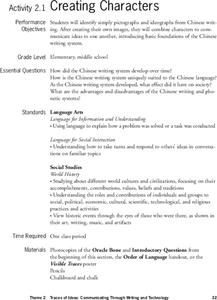
Creating Characters
Students identify simple pictographs and ideographs from Chinese writing. They create their own images, and combine characters to communicate ideas to one another, introducing basic foundations of how elements of the Chinese writing...
Curated OER
Birthday Graph
Learners explore graphs. For this graphing math lesson, students record the birthdays of each classmate on a data table. Learners cut out and add a picture of a birthday cake to a floor or wall pictograph representing the month in...
Curated OER
Dealing with Data
Seventh graders collect and analyze data. In the seventh grade data analysis lesson, 7th graders explore and/or create frequency tables, multiple bar graphs, circle graphs, pictographs, histograms, line plots, stem and leaf plots, and...
Pennsylvania Department of Education
Freckle Face
Students collect and record data. In this early data analysis lesson, students gather data about their partners face. As a class, the students use tally marks and pictographs to record the data and answer question about the information...
Curated OER
A Reading Graph
Young scholars construct and interpret a "favorite classroom books" graph. In this literacy and math graphing lesson, students choose a reduced size copy of the book cover that corresponds with the book(s) they chose to read during their...
Curated OER
Pictograph Cave
Fourth graders investigate the concept of using pictographs as rock art. They examine the discoveries of art made within caves in order to comprehend the culture that painted them. Students write creative stories about the images and...
Curated OER
Picture Writing
Fourth graders create symbols. In this visual arts lesson, 4th graders study cave drawings, Native American pictographs, and Aboriginal Drawings prior to creating their own communication without using words.
Curated OER
The Gathering and Analysis of Data
Young mathematicians gather data on a topic, graph it in various forms, interpret the information, and write a summary of the data. They present their data and graphs to the class.
Curated OER
Chinese Pictograms
In this Chinese writing worksheet, learners identify what and how to write Chinese pictograms. They explain in what ways each pictogram represents and how the combinations of symbols create a word or idea represented. Then students...
Curated OER
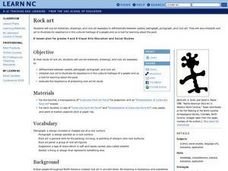
Rock art
Students study rock art they use art materials, colored photographs and rock art examples to: differentiate between symbol, petroglyph, pictograph, and rock art. They interpret rock art to illustrate its importance in the cultural...
Curated OER
OUR FAVORITE BEARS
Students state bear facts aloud, practice counting the nuber of bears aloud on the picture graph, read the picture graph and answer questions aloud about the data on the picture graph, and draw a picture of their favorite bear.
Curated OER
Dealing With Data
Students collect, organize, and display data using a bar graph, line graph, pie graph, or picture graph. They write a summary describing the data represented and compare the graph to another graph in the class.
Curated OER
Graphing Data
First graders explore the concept of graphing. In this data lesson, 1st graders gather information from a class survey and display their findings on a picture graph. Students also practice solving problems that their instructor models.
Pennsylvania Department of Education
Months of the Year
Learners develop a pictograph using the months of the year. In this months lesson plan, students place their name with their birth month on a large pictograph. They discuss the information they can see on the graph using the proper names...
Curated OER
Comparing School Bus Stats
Engage in a lesson plan that is about the use of statistics to examine the number of school buses used in particular states. They perform the research and record the data on the appropriate type of graph. Then they solve related word...
Curated OER
Pictographic Poetry of Current Events
Students discuss recent currents events as a class. Using one of the events, they write a poem about how they feel about the event in question. They choose specific symbols that relate to event and write a poem about it as well. They...
Curated OER
Numeracy Practice Math Sports
In this math activity, students match the pictographs to find the quantities and write each number sentence. They use the operation of addition.
Curated OER
Going Bananas: Addition and Graphing
In this addition worksheet, 1st graders will look at a picture to add the total number of bananas a monkey eats per day for five daily sums. Then students will answer four short word problems which require students to view the data as a...
Curated OER
School Activities
First graders place some specific types of objects (e.g., shoes, favorite food) on concrete graphs and pictographs. They listen and respond to others in a variety of contexts (e.g., pay attention to the speaker; take turns speaking in a...
Curated OER
Conversation Heart Graphing
Sixth graders review the different types of graphs (bar, line, pictograph) They predict the data set they can garner several boxes of conversation hearts. Students record their data using an Excel spreadsheet. They create a graph based...
Curated OER
Word Pair Analogies 3
Designed for English language learners, but a good practice activity for all kids, this resource focuses on SAT words like saccharine, pragmatic, and precept. Effective scaffolding is provided here, as the last two questions require the...


