Curated OER
When Ants Fly
Here is a great lesson on constructing line graphs. Learners identify common characteristics of birds, ants common needs of all living things. They also write a story from the perspective of an ant or a bird that has lost its home and...
Curated OER
Algebra 2 Desmos Graphing Project
Encourage class members to get creative with functions. Pairs write their names and draw pictures using a graphing application with a collaborative graphic project. The resource provides the requirements for the project, as well as a...
Curated OER
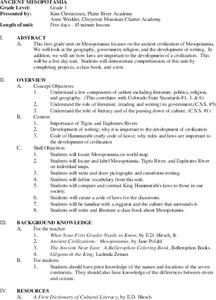
Ancient Mesopotamia
Students locate ancient Mesopotamia on a map. They examine the religion, government and the development of writing. They write and draw pictographs and cuneiform writing. They create a class book based on their investigations.
Curated OER
Apples Galore! (Elementary, Language)
Fifth graders examine and taste 7-8 difference apples, describe the flavor/texture, then graph the results of favorites. Finally students write a paragraph describing their favorite.
Curated OER
Symbols Communicate Without Words
Students write different symbols we use in writing out in their word form. In this word symbols lesson plan, students practice writing out what the symbols represent. For example the symbol % stands for 'percent'.
Curated OER
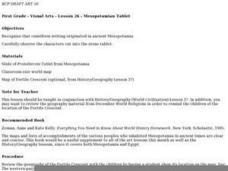
Mesopotamian Tablet, Egyptian Art
First graders examine cuneiform writing from a stone tablet, then write a simple sentence using pictographs. They analyze various examples of Egyptian art, construct a model of an Egyptian boat, and create a class painting using glyphs...
Curated OER
Pictograph Robe Stories
Fourth graders explore the diversity and commonality of human interdependence. Also, the global cooperation of the people of the United States and the world through a multicultural and historical perspective. They describe the...
Curated OER
Ancient China
Unveil the mysteries of ancient China in this presentation, which includes photographs of historic relics from the Neolithic and Bronze Ages. Slides detail the Hsia, Shang, and Zhou Dynasties; especially helpful is the final slide, which...
Curated OER
Data From Interviews
Students create and conduct a survey about favorite foods, gather and represent the data, interpret data and make predictions to present to the class. They create and use interview questions to gather data. Pupils are explained that...
Curated OER
Types of Graphs
Fifth graders construct graphs. In this graphing lesson plan, 5th graders learn about various types of graphs such as bar, line, circle, picture and stem and leaf plot. Students work in groups to create examples of each graph.
Curated OER
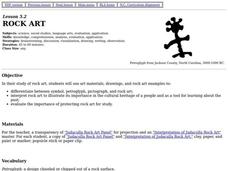
Rock Art
Fourth graders examine and interpret rock art to illustrate its importance in the cultural heritage of a people and as a tool for learning about the past. They create their own rock art that is a symbol of their culture.
Curated OER
What's Your Favorite Season?
Students collect data on the favorite seasons. In this data collection and analysis lesson, students learn about displaying data on charts and graphs. They collect data about the favorite seasons of the children in their class and...
Curated OER
Data Analysis, Probability, and Discrete Mathematics
Fourth graders analyze the data in a bar graph, pictograph, line graph, and a chart/table and draw conclusions based on the data. They discuss each type of graph, write questions for each graph, and analyze the data as a class.
Curated OER
Worth a Thousand Words
First graders examine the significance of the American bison to the American Indians of the Great Plains. They create a story in pictographs in the style of American Indians of the Plains.
Curated OER
Does One Tree a Forest Make?
Students take a walk around the schoolyard looking at and identifying the trees. One leaf for each tree is collected. A chart is developed that represents the population of trees on the school ground. They keep journals and write an essay.
Curated OER
Download and Analyze
Students download information from a NASA website into a database. They transfer it to a spreadsheet by completing the information and analyze the information. They determine temperature averages, mode, and graph the results. They write...
Curated OER
Energy Resources
In this energy resources worksheet, students complete 12 questions in the format of puzzles, teasers, and twisters. Examples include a modified cryptoquip and pictogram.
Curated OER
Social Studies: People in the Rocks
Learners discover characteristics of Native Americans as depicted in their rock art. By examining the rocks from the Human Figures Photo Gallery, they make inferences about the activities and purposes of the people drawn on them.
Curated OER
A Walk in the Woods: The Legacy of the Haudenosaunee
Fourth graders explore folktales and legends to investigate the life and culture of the Haudenosaunee Indians. The stories and food of the six Nations are experienced as the lesson proceeds.
Curated OER
Buffalo Hide
Young scholars study about the Native American practice of writing stories on buffalo skins. They study about pictographs and use symbols to write their own stories using "buffalo hides" they have created.
Curated OER
Color Tile Graphing
Young scholars explore data. They gather data and generate questions about the data in pictographs, tallies, tables, and bar graphs. Students use color tiles pulled by random to create their own bar graph. They discuss the bar graphs...
Curated OER
Charting Animal Life Spans
Second graders research animal life spans and complete related math activities. In this life span lesson, 2nd graders read How Many Candles and discuss life spans. Students arrange animal cards based on their life spans. Students find...
Curated OER
Birthdays
Students collect data about the birth months of each classmate using a calendar. They make a table with the information before designing a pictograph using cupcake images. They answer questions using the graph.
Curated OER
C is for Cookie-A MEAN-ingful Graphing Activity
Third graders, in groups, dissect a variety of brands of chocolate chip cookies and calculate the mean for each brand. They create their own bar graphs, pictographs, and line graphs to represent information.


