Curated OER
My Test Book: Reading Pie Charts
In this math skills worksheet, students solve 9 multiple choice math problems that require them to read and interpret charts. Students may view the correct answers.
Curated OER
Piggie Pie!
Students explain about their experiences on the farm and draw pictures to show what they know. Students read the recipe for the piggie pie that Gritch was going to use. Students estimate and then measure how many pigs it would take to...
Curated OER
Introduce Vocabulary: How to Make an Apple Pie and See the World
Students explore language arts by reading a fiction book in class. For this tier two vocabulary lesson, students read the book How to Make an Apple Pie and See the World and identify the use of specific vocabulary words. Students define...
Curated OER
Peace Pie
First graders review peacemaking strategies by identifying their capacity of creating and promoting peace within their classroom, home, community, and world. Fractions are introduced through the making of a "peace pie."
Curated OER
Creating Bar Graphs and Pie Graphs
Second graders observe a demonstration of the creation of a bar graph and a pie graph of their favorite colors. They gather information about various topics from their classmates, then organize the information, creating a bar and a pie...
Curated OER
The Water Cycle
Third graders investigate water formations by conducting an experiment. In this water properties lesson, 3rd graders utilize pie tins, sponges and salt shakers to create an evaporation and saturation experiment. Students collaborate in...
Curated OER
Usage and Interpretation of Graphs
Students explore graphing. In this graphing lesson, students predict how many shoe eyelets are present in the classroom. Students count eyelets and work in groups to organize and chart the data collected. Students put all the data...
Curated OER
Weather
Students create a spreadsheet and chart using data collected. In this weather lesson, students select five cities from their state, including the city they live in. Students take daily temperature readings from all five cities. ...
Curated OER
Author's Purpose
Determining an author's purpose can help readers understand a text more deeply. Using a PIES chart (persuade, inform, entertain, share) and poems from Leaf by Leaf: Autumn Poems by Barbara Rogasky, class members organize lines that show...
Curated OER
Discovering Mitosis in Onion Roots
High schoolers discover the different stages of mitosis by examining onion roots under a microscope, drawing diagrams of what they see, and organizing collected data in a chart and create a pie graph from their lab data.
Curated OER
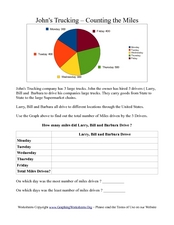
John's Trucking- Counting the Miles
In this graphs worksheet, students analyze a pie graph showing miles driven by three truck drivers in a week. Students fill out a chart in which they calculate total miles driven.
Curated OER
Ten Red Apples; The Five Senses
A clever lesson plan designed around an apple awaits your learners. Descriptive words are used to explain what they believe is inside a bag while using their five senses. Learners read the story The Apple Pie Tree and are introduced to...
Curated OER
The Body and the Five Senses
Read De la cabeza a los pies once for your learners before teaching them the body movements that accompany the book. Then, read it again and have the learners demonstrate the movements! There's also a chart to help reinforce some of the...
Curated OER
Place Value (d4)
In this identifying place values worksheet, students fill in a chart of three digit place numbers and read numbers and fill in the blanks indicating their place values. Students write twelve answers.
Curated OER
What's in a Graph?
How many yellow Skittles® come in a fun-size package? Use candy color data to construct a bar graph and a pie chart. Pupils analyze bar graphs of real-life data on the Texas and Massachusetts populations. As an assessment at the end of...
Curated OER
¿Qué es un sustantivo?
What is a noun? A noun is the same thing in Spanish as it is in English, so your learners should catch on pretty quickly. Give them the chart included here, and have them organize all of the words provided into the appropriate categories...
Scholastic
Quick as a Cricket Lesson Plan
Teaching young learners about similes is easy as pie with this primary grade language arts activity. Following a class reading of the children's book, Quick as a Cricket by Audrey Wood, young readers learn the definition of a simile as...
Eastconn
Women of the California Gold Rush
The California Gold Rush was not just an opportunity for the male gold miners sifting for shiny nuggets. Small groups read accounts of the ways women took advantage of the influx of workers to run hotels, bake pies, and wading out into...
Curated OER
Data Handling
In this data handling worksheet, 6th graders solve and complete 4 various types of problems. First, they draw a bar chart to represent the information provided in the table shown. Then, students show beneath the table how to work out the...
Curated OER
Graph Lab
Seventh graders explore bar graphs and pie charts. Given a pack of M&Ms, 7th graders explore the colors, sort the data in a frequency chart and then construct bar graphs and pie charts to categorize the M&Ms by color. Students...
Curated OER
Data Analysis
Students double check their data collections of Top 20 singles that they've been collecting for several days. Types of data is reviewed in detail and a variety of questions are asked for retention factors of mastery. They draw a tally...
Curated OER
Colours of the Church Year
In this Colours of the Church Year worksheet, students use the chart 'Colours of the Church Year' to complete the pie-chart with the Church seasons and fill in the missing words.
Curated OER
An American Ballad - Lesson 1
Students listen to and analyze the ballad "American Pie." They utilize a worksheet imbedded in this plan. They circle the appropriate descriptive words of the song's medium form, melody, tempo and dynamics, and style.
Curated OER
Counting And Graphing
Students explore counting and graphing. In this math lesson plan, students practice counting from 1-25 and are exposed to two types of graphs: the pie graph and the bar graph. Students use Skittles to represent a variety of measurements.


