Curated OER
Graph a Panther's Diet
Students examine the diet of panthers. In this interpreting data lesson, students collect data on the panther's diet and chart the data in bar and pie graphs.
Curated OER
ie, igh, and y
In this long "i" sound activity, students put words into the correct column in the chart. Students fill in the chart with ie, igh, and y words. Students fill in 21 words.
Curated OER
State Economy Chart
Fifth graders create a 3D Pie graph using the Chart Wizard in Excel to represent their assigned states' data. They discuss the similarities and differences between states, and form a hypothesis on the relationship between location and...
Curated OER
Dynamite Data
Second graders rotate through a variety of stations designed to offer practice in manipulating data. They sort, tally and count items and then create bar graphs, tables, and pie graphs to record their findings.
Curated OER
Identifying Different Types of Graphs
This is an outstanding presentation on graphs and statistics. Learners choose which type of graph is being shown, and also gain practice in the techniques used to find the mean, median, and mode of sets of numbers. Very good!
Curated OER
Fraction Spelling
An interesting take on spelling practice is included here! Emerging spellers take their weekly spelling list and create a three-column chart. In the first column, they write the word itself. In the second column, they write how many...
Curated OER
Surname Survey
Learners use data from the U.S. Census Bureau to determine whether last names in a local phone directory reflect the Census Bureau's list of the most common surnames in the country. In this surnames lesson plan, students use the Internet...
Curated OER
What's On Your Plate?
If you are teaching in a Christian school, Sunday School, or home school environment, then this instructional activity would be appropriate. The class discusses Biblical traditions and culture and how that related to current Christian...
Curated OER
Is it a solid or liquid?
Young scholars review the vocabulary terms solid and liquid. They also review that adjectives tell what kind, which one, and how many. The teacher introduces a "Oobleck" after reading "Bartholomew and the Oobleck" by Dr. Seuss. The...
Curated OER
From There To Here...
Students find out where some of the products in hour homes come from, then become aware of our local trash, landfills and incinerators. They chart and graph data and use maps for different purposes.
Virginia Department of Education
Graphs
Examine different types of graphs as a means for analyzing data. Math scholars identify the type of graph from a series of data displays and then develop questions to match each one. Then, given a scatter plot of height versus age data,...
Curated OER
Interpreting and Displaying Sets of Data
Students explore the concept of interpreting data. In this interpreting data lesson, students make a line plot of themselves according to the number of cubes they can hold in their hand. Students create their own data to graph and...
Curated OER
Spreadsheet Graphs
Students create graphs using information from spreadsheets. They select a topic from the following choices: website use, digital cameras, spreadsheets, calculators or educational software. They tally the class results and create an...
Curated OER
Twelve Days of Christmas
Learners create charts and graphs using a spreadsheet. They chart the number of each gift given day by day from the song, "The Twelve Days of Christmas." They create a bar graph and a circle graph from their data on the spreadsheet.
Curated OER
Count The Letters
Students perform activities involving ratios, proportions and percents. Given a newspaper article, groups of students count the number of letters in a given area. They use calculators and data collected to construct a pie chart and bar...
Curated OER
Recycling Statistics
In this environment worksheet, students look for the answers to the environmental impact of recycling in Great Britain with the statistics from the pie graph.
Curated OER
Past Meets Present
Third graders examine coins to become familiar with architectural structures. In this past meets present instructional activity, 3rd graders research and complete worksheets on Guam. Students combine their group research into pieces of...
Curated OER
What Color Are Your Skittles?
Students create spreadsheets and manipulate data. They collect data, create appropriate graphs and use percentages to describe quantities. Students compare and contrast data. They use spreadsheets to generate a pie chart.
Curated OER
Thinking About Technology: What Is It? How Can It Help Us?
What is technology and how can it help us? Using a worksheet, students read a list and choose practical applications of scientific knowledge, brainstorm examples of home, school and hospital technology, graph answers in a pie chart, and...
Curated OER
Counting Candies
Learners count, sort, and classify jellybeans by color. They use their data to create a bar graph. Students are given a small bag of jellybeans, and a worksheet on Counting Candies Tally Chart. They work in small groups. Learners are...
Curated OER
It's Alive! Using Microorganisms in Cooking
Students create a KWL chart about food. In this chemistry activity, students differentiate physical and chemical changes. They explain how microorganisms are used in food preparation.
Virginia Department of Education
Igneous Rocks
High schoolers explore igneous rocks by observing rock samples and considering cooling rates and composition. The third installment of a five-part geology series culminates in an activity where learners use igneous rock characteristics...
Curated OER
Junk Food Math
Students use Skittles candies as they explore estimation and percentages. In this math lesson plan, students sort, count, and chart Skittles candies to learn about estimation and study percentages.
Curated OER
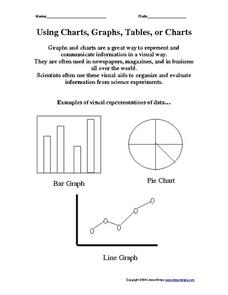
Using Charts, Graphs, Tables, or Charts
For this charts, graphs and tables worksheet, students view 3 different types of visual representations of data, make a list of 20 items and decide how the items can best be put together in groups to make a graph, chart or table....


