Curated OER
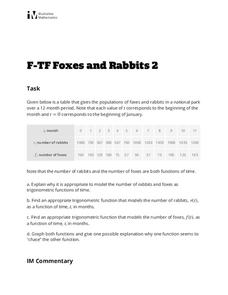
Foxes and Rabbits 2
Explore the relationship between the population of foxes and rabbits in a national park using trigonometric models. Plot data and find the appropriate trigonometric functions. Two questions require interpretation and explanation of...
Curated OER
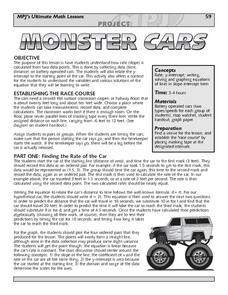
Monster Cars: Slope
Students examine how a rate is calculated from two points. Using battery operated cars, pairs of students measure time and distance. Afterward, they use this data to calculate the rate. Students then plot four ordered pairs and discover...
Curated OER
Single Event Upsets in Aircraft Avionics
In this aircraft avionics activity, science fans read about the first unmanned air vehicle that collects data about the Earth and is subject to damage by cosmic ray showers. Pupils analyze two graphs of data showing the neutron flux vs....
Curated OER
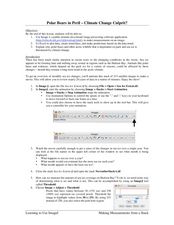
Polar Bears in Peril - Climate Change Culprit?
High schoolers explore the changes in sea ice over several years. In this life science lesson, students review and examine 20 years of data. They use Excel to graph data and analyze trends.
It's About Time
How Do Carbon Dioxide Concentrations in the Atmosphere Affect Global Climate?
Does carbon dioxide really affect temperatures across the world? This fifth installment in a six-part series investigates the relationship between carbon dioxide and global temperatures. Graphs created from genuine data help young...
Rochester Institute of Technology
Skateboard Performance Testing
Perform an activity on performance testing with a lesson focused on the purpose of wheel bearings on skateboards. Learners conduct performance testing on a skateboard to collect and interpret data.
Curated OER
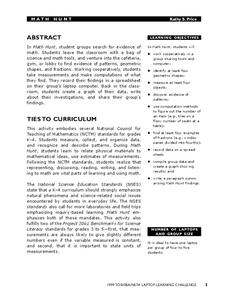
Math Hunt
Go on a scavenger hunt around your school to find evidence of math. Investigate different areas of your school for patterns, fractions, and different geometric shapes. Finally, create a spreadsheet and plot the data you've collected.
Miami University
Chapter Nine Worksheet: Monopoly
Advanced economics pupils analyze a series of graphs, data sets, and profit scenarios all related to monopolies and marginal revenue. They read through the background information, complete a graph using the data provided, and justify...
Illustrative Mathematics
Block Scheduling
If a random sample determines that 45% of students favor block scheduling, is it possible that the actual percentage might be 50% or 60%? In this task, learners use data from a computer-generated simulation to determine the plausibility...
Virginia Department of Education
z-Scores
Just how far away from the mean is the data point? Pupils calculate the standard deviation for a set of data and find out how many standard deviations a point is away from the mean. The teacher leads a discussion on how to calculate...
Curated OER
The Game is Afoot - A Study of Sherlock Holmes
Mystery is an exciting genre for young readers to investigate. The plots are so intriguing! Here is a series of lessons featuring Sherlock Holmes stories that invite learners to enter the world of the mystery genre. Based on what they...
Curated OER
Folktale Writing
Review literary analysis techniques with this reading lesson about folktale writing. Middle schoolers read different folktales from many authors, and write their own folktales to share with the class. They identify the plot, morals and...
Merlyn Education and Climate Protection Project
Short Story Lesson Plan: "Ghostwriter" By Kyle Downey
Frankenstein, Mr. Data, Hal, and DEFCON, the computer featured in Kyle Downey’s tale, “Ghostwriter,” all illustrate the dangers of creating intelligent life. After reading Downey’s story, class members craft their own narrative in which...
Curated OER
The Legend of Sleepy Hollow
Explore Washington Irving's "The Legend of Sleepy Hollow" in this literature analysis instructional activity. Middle schoolers read and summarize the plot of the story. They then adapt passages for a contemporary audience and analyze the...
Association of Fish and Wildlife Agencies
Schoolyard Biodiversity Investigation Educator Guide
In 1980, in the tropical rainforests of Panama, scientists discovered 1,200 species of beetles living in and around just 19 trees, with most of the species new to science—that's biodiversity! In the activity, learners work in teams to...
CCSS Math Activities
Smarter Balanced Sample Items: 6th Grade Math – Claim 4
Develop a model for prep. The resource provides examples of how items reflect modeling and data analysis for Smarter Balanced assessments. Items use on-grade or below-grade content to focus on the modeling aspect. The questions revolve...
Curated OER
The Parachute
Students discuss parachutes and write a procedure to determine the effect of different size parachutes and different masses on the time it takes the masses to fall. They record all their data from their experiment then write three...
American Statistical Association
What is the Probability of “Pigging Out”
Learners apply their understanding of luck to a probability experiment. They play a game of Pass the Pigs to determine the probability of a specific outcome. Using analysis for their data, pupils declare the measures of center, dot...
Firelands Local Schools
Exponential Growth and Decay
How can you safely model exponential growth and decay? A hands-on activity uses candies to model not only exponential decay, but also exponential growth. Exponential equations are fitted by hand and by use of a calculator to the data...
Virginia Department of Education
Heat Transfer and Heat Capacity
It's time to increase the heat! Young chemists demonstrate heat transfer and heat capacity in an activity-packed lab, showing the transitions between solid, liquid, and gaseous phases of materials. Individuals plot data as the changes...
Curated OER
History's Thermometers
Ancient coral beds give scientists clues to past ocean temperatures in much the same way that tree rings indicate historical weather conditions. High school scientists examine coral oxygen isotope ratios and plot the data as a function...
Curated OER
Foliage Tracker
Young scholars discuss the change of leaf colors and the role that climate and elevation play in those changes. They then track leaf changes, input data, and graph foliage changes with a free online tool.
Curated OER
The Greenhouse Effect
Why does it get so hot inside of our cars in the summertime? The greenhouse effect! Lab groups experiment to see what happens to an ice cube enclosed in a jar and placed in sunlight as compared to an ice cube outside of the jar. They...
Curated OER
The Breaking of Charity
The danger of mob mentality is on display in The Crucible by Arthur Miller. Get your class thinking with some challenging quickwrite questions, then assign characters from the play to be read aloud altogether. Links to worksheets for...


