Kenan Fellows
Least Squares Linear Regression in R
The task? Determine the how effective hospitals are at reducing the rate of hospital-acquired infections. The method? Data analysis! Using an open source software program, individuals use provided data and create scatterplots to look for...
Willow Tree
Graphing
So many methods and so little time! The efficient method of graphing a linear equation depends on what information the problem gives. Pupils learn three different methods of graphing linear equations. They graph equations using...
Curated OER
In the Wake of Columbus
Students explore how the population decreased in native cultures.
Georgia Department of Education
Math Class
Young analysts use real (provided) data from a class's test scores to practice using statistical tools. Not only do learners calculate measures of center and spread (including mean, median, deviation, and IQ range), but also use this...
Curated OER
Volume, Mass, and Weight
Study the difference between mass and weight. Your math group will compare the weight of an item to the amount of space that it uses. They'll then use conversion factors to find the difference between kilograms and pounds. Essential...
Curated OER
Is Grandpa Right, Were Winters Colder When He Was a Boy?
Young scholars compare current weather data to historic data to see if there is a temperature change. In this weather instructional activity students complete a lab activity and determine average changes in temperature, precipitation...
Curated OER
Modeling Population Growth
Young scholars create linear, exponential, and quadratic models of U.S. population data to determine which function best represents U.S. population growth. They predict future populations based on each model.
Curated OER
Famous People: Student Worksheet
Older learners consider a list of famous people, and they fill in two columns; one in which they guess the celebrities' ages, and another where they look up their actual age. They construct a graph by assigning one of the columns the x...
Curated OER
Jon and Charlie's Run
Let's use math to solve an argument. Jon and Charlie are debating about who can run farther, but who is right? That's what your class will figure out as they apply their understanding of fractions to this real-life situation. A simple,...
EngageNY
Modeling Linear Relationships
Math modeling is made easy with the first installment of a 16-part module that teaches pupils to model real-world situations as linear relationships. They create graphs, tables of values, and equations given verbal descriptions.
Curated OER
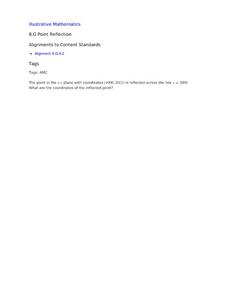
Point Reflection
Use this task as an exit ticket for your eight graders during the geometry unit. All they need to do is identify the coordinates of a point reflected over y=2000.
David Pleacher
Candy Math Fun
Few things can motivate children to learn like the promise of a sweet and tasty treat. Given a bag of M&M®s, Skittles®, or other colorful candy, students first predict the contents of the bag before counting the pieces, creating a...
EngageNY
Estimating Centers and Interpreting the Mean as a Balance Point
How do you balance a set of data? Using a ruler and some coins, learners determine whether the balance point is always in the middle. Through class and small group discussions, they find that the mean is the the best estimate of the...
Soft Schools
Onomatopoeia in Literature
Identifying onomatopoeia is one thing; making an inference about the significance of the sound is more advanced. Young poets read a literary passage and identify the examples of onomatopoeia in each before naming the source of the sound.
Curated OER
Drops on a Penny
Young scientists explore the concept of surface tension at is applies to water. In this activity, learners use a dropper to place drops of water on a penny. Each group guesses how many drops a heads-up penny will hold, then conducts the...
American Statistical Association
An A-MAZE-ING Comparison
Teach your class how to use descriptive statistics through a hands-on data collection activity. Pupils collect their own data, calculate test statistics, and interpret the results in context. They compare male and female results, looking...
Statistics Education Web
Using Dice to Introduce Sampling Distributions
Investigate the meaning of a sample proportion using this hands-on activity. Scholars collect data and realize that the larger the sample size the more closely the data resembles a normal distribution. They compare the sample proportion...
Statistics Education Web
It’s Elemental! Sampling from the Periodic Table
How random is random? Demonstrate the different random sampling methods using a hands-on activity. Pupils use various sampling techniques to choose a random sample of elements from the periodic table. They use the different samples to...
Illustrative Mathematics
Paying the Rent
Learning how a bank account works is a useful tool. The exercise in the resource is to deduct rent from a checking account and create an equation from a description. Participants then graph the balance of the bank account versus months...
Statistics Education Web
10,000 Steps?
Conduct an experiment to determine the accuracy of pedometers versus pedometer apps. Class members collect data from each device, analyze the data using a hypothesis test, and determine if there is a significant difference between the...
Statistics Education Web
Who Sends the Most Text Messages?
The way you use statistics can tell different stories about the same set of data. Here, learners use sets of data to determine which person sends the most text messages. They use random sampling to collect their data and calculate a...
Bytes Arithmetic
Geometry Pad+
Graphing paper, pencil, ruler, protractor, and compass, all get replaced or supplemented with this dynamic geometry application. Here, you can create, move, and scale many different shapes, as well as, explore and change their properties...
Curated OER
Snow Cover by Latitude
Students create graphs showing the amount of snow coverage at various points of latitude and compare graphs.
Curated OER
Graphs and Equations
In this graphs and equations worksheet, students solve and complete 5 various types of problems. First, they complete a table of values for a given quadratic function. Then, students use the graph to find an estimate for the solutions of...
Other popular searches
- Line Plot Worksheets
- Line Plot
- Line Plot Graphs
- 1st Grade Line Plot
- Free Line Plot
- Line Plot Pictures
- Frequency Table Line Plot
- Scatter Plot Trend Line
- Line Plot Outliers
- Fraction Line Plot
- Math Line Plot
- Free Line Plot Worksheets


