Curated OER
Lines of Fit
Students analyze graphs. In this algebra lesson, students find the line of best fit, using scatter plots. They calculate the sale of popcorn as it relates to the price. They then analyze the graphs for positive, negative and no correlation.
Curated OER
Lines of Fit
Students graph an equation and analyze the data. In this algebra lesson, students graph scatter plots and identify the line of best fit using positive correlation, negative correlation an d no correlation. They apply their data analysis...
Curated OER
Mathematics of Doodles
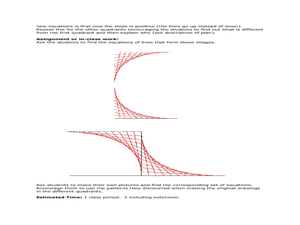
Students use the slope and y-intercept to graph lines. In this algebra lesson, students graph linear equations and apply it to solving real life problems.
Curated OER
Linear Motion 6
In this linear motion activity, students answer 12 questions about acceleration, velocity and distance traveled. They interpret diagrams and indicate the location of an object if it has positive, negative or no acceleration. They...
Curated OER
Lines
In this Algebra I/Algebra II worksheet, students determine the slope of a line, write the equation of a line, examine parallel and perpendicular lines, and solve problems involving linear relationships. The two page worksheet contains...
Curated OER
Incline Planes
Students determine the forces necessary to move a truck on an inclined plane with weight and slope as variables. They identify the cheapest way to transport trash to local garbage disposal sites.
Curated OER
Velocity
For this pre-calculus worksheet, students calculate the velocity of a linear graph by observing the slope of a line. There are 10 velocity questions.
Curated OER
Chapter 7. Functions and Graphs
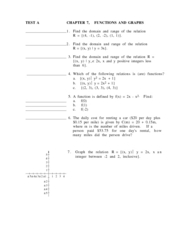
In this functions and graphs worksheet, students determine the domain and range of a given relation. They graph functions on a coordinate plane and write equations in the slope-intercept form. This twelve page worksheet contains 30...
Inside Mathematics
Graphs (2007)
Challenge the class to utilize their knowledge of linear and quadratic functions to determine the intersection of the parent quadratic graph and linear proportional graphs. Using the pattern for the solutions, individuals develop a...
Charleston School District
The Line of Best Fit
If it's warm, they will come! Learners find a line of best fit to show a relationship between temperature and beach visitors. Previous lessons in the series showed pupils how to create and find associations in scatter plots. Now, they...
Curated OER
Solving Systems of Equations by graphing for Algebra One
Students watch the teacher demonstrate on an overhead projector how to graph various equations before the students try them on their own. They start with pencil and paper; once they grasp the concept they move on to punching in the...
Curated OER
Linear Functions
Students solve, identify and define linear equations. In this algebra lesson, students calculate the slope and y-intercept of a line. They graph the line given two points and the slope.
Curated OER
Let's Go Slopey
Young scholars create a table of values to graph a line. In this algebra lesson, students identify the slope and intercept of a linear equation. They use a Ticalculator to graph their function.
Curated OER
Particle Motion1
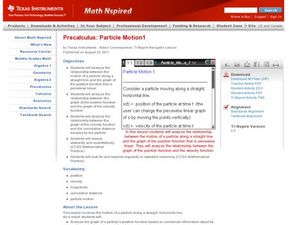
Students analyze piecewise functions. For this precalculus lesson, students identify the position, velocity and distance. They analyze the relationship between the graph, its position and velocity.
Curated OER
Graphing Linear Equations with Calculator
Students graph lines using the calculator. In this algebra lesson, students graph lines of equations in the form y=mx+b. They input equations into the TI Calculator and graph using the slope and intercept. They analyze the graph for...
Curated OER
Exploring Deep Ocean Habitats: Alien Invasion
Young scholars compare and contrast "alien species" and "invasive species."Students explain positive and negative impacts associated with introduction of non-native species, and give a specific example of species that produce t
Curated OER
A.P. Calculus Exam Prep
In this A.P. Calculus exam practice test, students answer 28 multiple choice questions. Questions cover a wide variety of topics. Kids tell the position of a particle moving along a horizontal line. They identify the solution to a...
National Council of Teachers of Mathematics
Varying Motion
For this secondary mathematics learning exercise, high schoolers collect data based on a person’s motion. From this data, students create graphs comparing displacement, velocity, and acceleration to time. The five-page learning exercise...
Curated OER
Quiz: Scatter Plots and Line of Best Fit
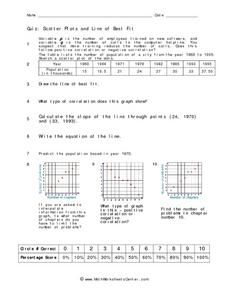
In this scatter plots and line of best fit worksheet, learners create scatter plots from given sets of data. They answer questions concerning the scatter plot. Students write the equation of a line, identify the type of correlation...
Curated OER
Rates Of Change
Students investigate the rate of change and how it effects a function over a given interval. They examine the slope of a line that is seccant and how it is compared to a tangent line and then determine the changes of a function at any...
Curated OER
Mathematical Techniques - Basic Graphing
Learners are introduced to significant figures and how to add, subtract, multiply and divide them. In a group, they practice plotting data points from a table to a graph and labeling all axes. They calculate the slope and y-intercept and...
Curated OER
Linear Equations
In this algebra worksheet, students solve linear equations using one and two steps. They solve systems of equations using substitution and elimination with graphing. There are links for ready made tests and quizzes.
EngageNY
Increasing and Decreasing Functions 1
Model situations with graphs. In the fourth installment of a 16-part module, scholars learn to qualitatively analyze graphs of piecewise linear functions in context. They learn to sketch graphs for different situations.
Charleston School District
Increasing, Decreasing, Max, and Min
Roller coaster cars traveling along a graph create quite a story! The lesson analyzes both linear and non-linear graphs. Learners determine the intervals that a graph is increasing and/or decreasing and to locate maximum and/or minimum...


