Curated OER
Using Excel to Draw a Best Fit Line
Students create line graphs for given data in Microsoft Excel. Students follow step by step instructions on how to create their graph, including how to create a trend line. Students print graphs without trend lines and manually draw...
Curated OER
Matrix Operations
Students solve problems using matrices. In this algebra lesson, students add, subtract and multiply matrices. They use the graphing calculator to simplify and graph linear equations.
Curated OER
Strongest Polygon
Learners define and identify shapes by name. In this geometry lesson plan, students construct, identify and compare polygons based on the number of sides. They classify each shape based on their angle sum theorem.
Curated OER
Let's Line Them Up!
In this line graph instructional activity, students read through the problems about graphing and line graphs. Students select the best answer to solve the 10 online questions.
Curated OER
Cashton Community Quilters
Fourth graders create and construct a fabric quilt symbolizing the heritage of the Wisconsin community of Cashton. They research Wisconsin historical symbols and use math skills to calculate the number and sizes of the quilt squares. ...
Curated OER
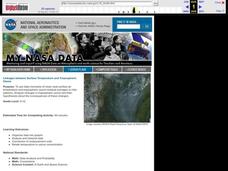
Linkages Between Surface Temperature And Tropospheric Ozone
Students organize and analyze data regarding changes in tropospheric ozone and then hypothesize about the consequences of these changes.
Curated OER
A Worm World
Students maintain a compost bin and build a worm observatory. They design experiments relating to worms and record observations in a worm journal.


