Curated OER
Starting With Stats
Statisticians analyze a data set of student IQs by finding measures of central tendency and dispersion such as mean, median, mode, and quartiles. They practice using a graphing calculator to find the values and analyze box plots and...
Curated OER
What's My Pattern?
Students recognize, describe and extend patterns in three activities. They organize data, find patterns and describe the rule for the pattern as well as use the graphing calculator to graph the data to make and test predictions. In the...
Center of Excellence for Science and Mathematics Education
A Sick Astronaut
Aspiring astronauts graph, interpret, and analyze data. They investigate the relationship between two variables in a problem situation. Using both graphic and symbolic representations they will grasp the concept of line of best fit to...
Curated OER
Traveling Through the Solar System
Students use calculator and non-calculator methods for analyzing data. They apply data collection and analysis in a study of mass and weight. Students enhance and apply the concept of line of best fit. They master graphing in a plane,...
Curated OER
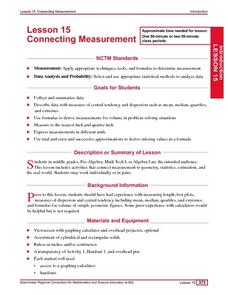
Connecting Measurement
Students participate in activities the connect measurement to geometry, statistics, estimation, and the real world. They collect measurements from their elbow to the tip of their middle finger and make a box plot of the data as well as...
Curated OER
EBT-rimental
Students engage in a lesson plan that gives them the tools needed to become knowledgeable credit consumers. The companion website for the ITV program TV-411 is used to provide learners with an interactive experience of what credit has to...
Curated OER
Are things Really More Expensive Today?
Students explore the topics of inflation and deflation within the economy. The Consumer Price Index is used to contrast the price of goods today with that of years past.
Other popular searches
- Pre Calculus
- Pre Calculus
- Pre Calculus Projects
- Pre Calculus Lesson
- Pre Calculus Graph
- Pre Calculus Limits
- Pre Calculus Help
- Pre Calculus With Limits
- Pre Calculus Assistance
- Pre Calculus Lesson Music
- Pre Calculus Equalibruim
- Pre Calculus Limits


