Curated OER
Applied Science - Science and Math Post-Lab
Students explore optical illusions. In this Applied Science activity, students view optical illusions and record the data of what they see. Students graph the data that they collect.
Curated OER
Density-Qualitative and Quantitative
Students investigate density using film canisters filled with different density materials and larger objects of varying density. For this density lesson plan, students discuss the concept of density and rank film containers from dense to...
University of North Carolina
Sociology
What exactly does sociology entail? Sociology is a broad field that covers many topics, including culture, mass media, and social movements. A helpful handout prepares scholars for typical writing found in college-level sociology...
Curated OER
Categorizing Data and Bias
In this categorizing data and bias worksheet, 9th graders solve 10 different problems that include various types of qualitative or quantitative data. First, they determine if the problem stated is univariate or bivariate data. Then,...
Curated OER
Work-Kinetic Energy Theorem
Young scholars prove the validity of the Work-Kinetic Energy Theorem by analyzing the Car and Driver website which lists qualitative and quantitative data about an assigned car. They decide whether or not they would purchase the car...
Curated OER
Quantitative versus Qualitative Decision Making
Students analyze the advantages and disadvantages of different quantitative methods. They identify at least three different qualitative factors in decision making and explain the impact of qualitative decision-making factors in relation...
Curated OER
Point Graphs
Learners experiment with point graphs. For this math lesson, students are divided into groups and perform an experiment to see how high a ball bounces, recording their results on a point graph. Learners then answer provided questions.
Curated OER
Saving Energy Through Ecological Landscape Design
High schoolers are able to transcribe to scale the plant features of a common landscape. They determine true north and south and collect and record data on a table. Students calculate a rating for and describe a definition of...
Curated OER
Qualitative Vs. Quantitative
Fourth graders examine the difference between qualitative and quantitative observations by doing a simple lab activity. This lesson plan can be used at any grade level. It involves the basic observation process skill.
National Wildlife Federation
Quantifying Land Changes Over Time in Areas of Deforestation and Urbanization
Is qualitative or quantitative research more convincing when it comes to climate change? In the eighth lesson during this 21-part series, scholars begin by performing a quantitative analysis of deforestation and urbanization. Then, they...
Perkins School for the Blind
The Mystery Box - Making Observations and Collecting Data
Making observations and collecting qualitative and quantitative data is a vital skill all scientists need to practice. Help your scientists with partial and no sight learn how to use their other senses to make observations for...
Curated OER
World War II - War Comes to Hawaii
Ninth graders use geographic representations to organize, analyze, and present information on people, places, and environments. They use tools and methods of geographers to construct, interpret, and evaluate qualitative and quantitative...
Curated OER
Water and Polymers
Learners conduct qualitative and quantitative investigations based on the interaction between water and various polymers. They determine the percent moisture contained in various plastics along with a qualitative procedure to determine...
Bethel School District
Observations and Inference
What's the difference between qualitative and quantitative observations? Learners make observations, inferences, and predictions about their environment with a set of questions and activities that are applicable to either language arts...
Curated OER
Understanding the 1855 Census Database
Use data from the 1855 New York census to better understand the Irish immigrant experience during the late 19th century. Young historians analyze information from the census and build three hypotheses regarding the residents of the Five...
NASA
Earth’s Energy Budget - Seasonal Cycles
Earth's energy budget should be in the red. Young researchers review satellite data in a presentation to study Earth's solar radiation. They make both qualitative and quantitative observations about variations in available seasonal...
Curated OER
Data Collection and Presentation
Students concentrate on discrete quantiative data. They are shown that the vertical line diagram as a more appropriate way to present discrete quantiative data then bar charts. Students work as a group to help with the interpretation...
Cornell University
Density
Certain things just do not mix, including liquids of varying densities. Learners collect data to determine the densities of several liquids. They then use the density information to predict the type of liquid.
Made by Educators
Sociological Methods
First year undergraduate sociology students can prepare for their exams with an application that provides practice questions in six categories: Quantitative and Qualitative Data, Sources of Data, Primary and Secondary Data, Positivism...
Curated OER
How a Writer Conveys Descriptions With a Wallop
Students identify strategies the author used to vividly convey qualitative and quantitative aspects of life in China, then use those strategies in writing of their own. They examine the author's writing style and techniques to learn some...
Charleston School District
Increasing, Decreasing, Max, and Min
Roller coaster cars traveling along a graph create quite a story! The lesson analyzes both linear and non-linear graphs. Learners determine the intervals that a graph is increasing and/or decreasing and to locate maximum and/or minimum...
Curated OER
Acceleration and Velocity
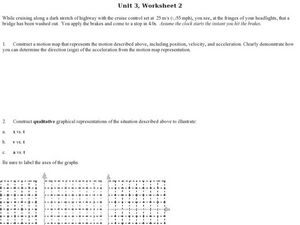
In this acceleration worksheet, students construct a motion map and a qualitative and quantitative graphical representation to determine the motion of a car after it applies its brakes. This worksheet has 8 problems to solve.
Curated OER
Introduction to Scientific Methods
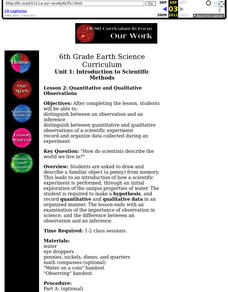
Sixth graders distinguish between an observation and an inference distinguish between quantitative and qualitative observations of a scientific experiment. They record and organize data collected during an experiment.
Curated OER
Questionnaires and Analysis
Students, review the techniques and different types of data analysis as well as how they are expressed, identify why facts and data are needed in conclusion of a questionnaire. The concepts of qualitative and quantitative data are...


