Curated OER
Logarithms
For this logarithm worksheet, students read given statements about logarithms and determine if the statement is true or false. This one-page worksheet contains approximately 35 problems.
Curated OER
Scientific Observation of Force and Acceleration on an Object
In this force and acceleration worksheet, 8th graders answer ten questions based on two graphs. The first graph is a scatter plot, the second is a line graph.
Curated OER
An Apple a Day
Students study apples and then paint apples whichever color is their favorite apple color. They help create a bulletin board for the classroom. They graph the different colors of apples found on the board.
Curated OER
Quadratics: Polynomial Form
Pupils determine how changes in the coefficients in a quadratic function affect its graph. They Solve a quadratic equations. Students Determine how to use the equation to determine the intercepts of a quadratic function. They identify...
Curated OER
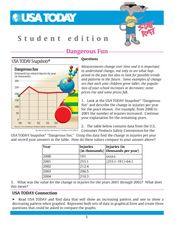
Dangerous Fun
For this line graph worksheet, students analyze the data on a graph about toy-related injuries by year. Students solve 5 problems in which the change in injuries per year is calculated and recorded on a table.
Curated OER
A is for Apple
Learners participate in a variety of activities to learn about apples. Students graph apples, learn about apple uses, taste apples, and observe what happens when apples are dipped in lemon juice.
Curated OER
Math, Sweet Math Activity Sheet
In this candy graphing worksheet, 1st graders will place candy on their paper to create a bar graph. They will answer several questions based on their data. A teacher checklist is provided.
Curated OER
Remembering the First
Students examine words and phrases associated with World War I as an introduction the era. They explore the legacy of World War I by reading and discussing "The War to End All Wars If Only." Students write obituries for fallen World...
Curated OER
Math Vocabulary Words
In this math vocabulary worksheet, students read 14 math vocabulary words relating to statistics and graphs. This would be an excellent tool for teachers to create a math vocabulary word wall. Teachers could use these labels and...
Curated OER
Equations and Inequalities
For this equations and inequalities worksheet, 9th graders solve and graph 8 different problems that include various systems of equations. First, they determine the solution to each set of system of equations. Then, students graph the...
Curated OER
Motion Musing
Learners investigate graphing a line. In this algebra lesson, students collect data on the path of a skateboarder. They collect how fast the board is traveling along a straight line and graph their results.
Curated OER
Quadratic Relation and Parabola
Students identify the vertex and intercepts of a parabola. In this algebra activity, students graph parabolas and factor quadratic equations. They perform transformation on the parabolas.
Curated OER
Identifying Implications
Students read a variety of reading passages and articles. They investigate how to make implications and assumptions using the information provided.
Curated OER
FUN WITH MAPS
Fifth graders learn map skills by showing the routes they travel from home to school and using that data to practice map reading and interpreting geographical information.
Curated OER
National Longitudinal Survey of Children and Youth (NLSCY)
Students review data analysis techniques. In this statistics lesson, students access statistical software regarding the National Longitudinal Survey of Children and Youth. Students read and interpret the data as they complete the...
Curated OER
Determining the Density of a Drop of Water-A Graphing Exercise
Middle schoolers determine the density of 1 drop of water. In this determining density lesson plan, students determine the mass and volume of a drop of water in the lab using appropriate lab techniques and calculate the density of a drop...
Curated OER
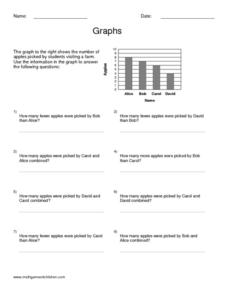
Graphs
For this algebra worksheet, students calculate the point of intersection between a circle and a straight line. There are 5 questions with an answer key.
Curated OER
Read a Map ... It's a Snap!
Young scholars are introduced to map and globe skills. They use grids and are able to construct their own simple maps of familiar places. Students are able to define a map, globe, and symbol and use the direction words north, south,...
Texas State Energy Conservation Office
Investigation: Greenhouse Effect
Pupils compare the temperature change in a closed and open box as a demonstration of the greenhouse effect.
Curated OER
Graphing
Fifth graders create graphs based on climate in South Carolina. They read and interpret information in a chart and construct a graphy from the information in the chart. They create a spreadsheet using Excel and publish 2 graphs.
Curated OER
The Guise of a Graph Gumshoe
Eighth graders practice constructing bar, circle, and box-and-whisker graphs. They practice reading and interpreting data displays and explore how different displays of data can lead to different interpretations.
Curated OER
High School Mathematics Problems from Alaska: Reading a Graph: Azimuth Range vs. Day in Barrow, Alaska
Students focus on reading and interpreting information from a graph.
Curated OER
Forest Activity: Interpreting a Graph
Students research forest growth online. They analyze the parts and contents of a graph, then summarize in narrative form the changes in the forest over time.
Curated OER
Impossible Graphs
Pupils distinguish between possible and impossible graphs of functions, and to learn why some graphs are impossible. They have practiced plotting functions on the Cartesian coordinate plane


