Curated OER
What's Your Shoe Size? Linear Regression with MS Excel
Learners collect and analyze data. In this statistics lesson, pupils create a liner model of their data and analyze it using central tendencies. They find the linear regression using a spreadsheet.
CK-12 Foundation
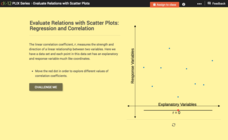
Evaluate Relations with Scatter Plots: Regression and Correlation
Introduce the concept of a correlation coefficient using an interactive lesson. Learners begin by manipulating a correlation coefficient and watching a graph change to represent the new value. Questions help strengthen their...
Curated OER
Influence and Outliers
Using the TI-Nspire calculator, statisicians identify outliers and their effect on the least-squares regression line. In finding the line of best fit, they determine what points will affect the least squares regressions and what points...
Texas Instruments
Finding Linear Models Part III
Explore linear functions! In this Algebra I lesson, mathematicians graph data in a scatter plot and use a graphing calculator to find a linear regression and/or a median-median line. They use the model to make predictions.
Curated OER
Barbie Bungee
Middle and high schoolers collect and analyze their data. In this statistics lesson, pupils analyze graphs for linear regression as they discuss the relationship of the function to the number of rubber bands and the distance of the...
Curated OER
Murder in the First Degree - The Death of Mr. Spud
Secondary learners investigate exponential functions in a real-world scenario. They collect data on the temperature of a cooling baked potato, enter the data into lists, and graph the data using a scatter plot before finding an...
Curated OER
Linear Regression on TI-82
In this linear regression worksheet, students graph linear regression problems using the TI-82 calculator. Instructions for using the calculator are provided. This two-page worksheet contains six problems.
Curated OER
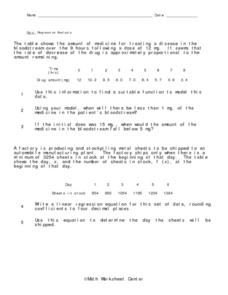
Regression Analysis
In this regression analysis activity, 9th graders solve 10 different word problems related to regression analysis. First, they use the information given to find a suitable function to model the data. Then, students use the model to...
Curated OER
The Regression Line and Correlation
Students investigate the best fit line through plotting on the TI. In this math activity, students examine their data representing regression lines and correlation. They use interactive technology to differentiate between linear and...
Texas Instruments
Making Predictions Using Systems of Equations
Students explore the concept of systems of equations. In this system of equations lesson, students enter data into lists on their calculators about 100 meter dash times. Students plot the points using a scatter plot and perform a linear...
Curated OER
Shake It Up with Scatterplots
Students identify how to use a scatterplot to compare two sets of data to determine if they are related. Then they identify and describe the definition of regression line (the "line of best fit"). Students also identify how scientists...
Curated OER
Let's Gather Around the Circle
Scholars explore the relationship between circumference and diameter. Groups of learners measure the diameter and circumference of round objects and record their data on a given worksheet. They then input the data into their graphing...
Statistics Education Web
The United States of Obesity
Mississippi has both the highest obesity and poverty rate in the US. Does the rest of the data show a correlation between the poverty and obesity rate in a state? Learners tackle this question as they practice their skills of regression....
Intel
Track the Trends
Allow your classes to research what interests them. An engaging STEM lesson, the fourth in the series of six, asks individuals to choose a topic of interest and analyze the data through regression models. The regression equations allow...
Statistics Education Web
NFL Quarterback Salaries
Use statistics to decide if NFL quarterbacks earn their salaries! Learners study correlation coefficients after using technology to calculate regression equations. Through the data, they learn the meaning of correlation and correlation...
Statistics Education Web
Text Messaging is Time Consuming! What Gives?
The more you text, the less you study. Have classes test this hypothesis or another question related to text messages. Using real data, learners use technology to create a scatter plot and calculate a regression line. They create a dot...
PBL Pathways
Students and Teachers
Predict the future of education through a mathematical analysis. Using a project-based learning strategy, classes examine the pattern of student-to-teacher ratios over a period of years. Provided with the relevant data, learners create a...
Curated OER
When the Snow is as High as an Elephant
High schoolers study the concept of mean values using a data plot. Learners enter the given data in the activity to create their data table. They use the data table to calculate the mean of the snowfall percentage provided in the...
Curated OER
Scatterplots and Regressions
In this scatterplots and regressions worksheet, students solve 6 different types of problems related to graphing scatterplots and interpreting regressions. First, they create a scatterplot from the given data coordinates and then,...
EngageNY
Modeling Relationships with a Line
What linear equation will fit this data, and how close is it? Through discussion and partner work, young mathematicians learn the procedure to determine a regression line in order to make predictions from the data.
American Statistical Association
Nonlinear Modeling: Something Fishy
There are plenty of fish in the sea, but only a few good resources on regression. Young mathematicians first perform a linear regression analysis on provided weight and length data for fish. After determining that a linear model is not...
Curated OER
Environmental Agents of Mathematics: Mathematics for Change
High schoolers analyze environmental science data using Math. They do research about renewable energy, gather data, create graphs and interpret their findings. Then the group presents their arguments persuasively using their findings to...
EngageNY
Modeling with Polynomials—An Introduction (part 2)
Linear, quadratic, and now cubic functions can model real-life patterns. High schoolers create cubic regression equations to model different scenarios. They then use the regression equations to make predictions.
Radford University
Earthquake Problem
Shake up things in the classroom. The unit uses earthquakes to bring a real-life connection to finding arc lengths, logarithms, and equations of circles. Small groups determine whether particular towns would have felt an earthquake after...


