Nuffield Foundation
Investigating the Effect of Temperature on the Activity of Lipase
How does temperature affect lipase activity? Young scholars conduct an experiment to collect data on the interaction of lipase at different temperatures. They add lipase to a solution of milk, sodium carbonate, and phenolphthalein and...
PBS
Broadcast News
Just because a story is on the news doesn't mean it's being presented fairly. Analyze news broadcasts with a instructional activity focused on evaluating television journalism. At home, kids watch a news show and note the stories...
NOAA
Thunderstorms, Tornadoes, Lightning. . . Nature's Most Violent Storms
Thunderstorms, tornadoes, floods, and hail are just a few of the topics covered in a thorough weather preparedness guide. With descriptions of each weather phenomenon, from what causes them to how and when they occur to levels of...
Charleston School District
Pre-Test Unit 3: Functions
How does an input affect an output? Assess your learners' ability to answer this question using this pre-test. Scholars answer questions about the basics of a function. Topics include determining if a table or statement represents a...
Curated OER
Two Sides, Same Coin: How Political Beliefs Influence Language Use
Learners read several magazine articles on the same topic written from different political perspectives, paying particular attention to the diction, syntax, and arguments presented in support the point of view expressed. They then select...
EngageNY
Why Worry About Sampling Variability?
Are the means the same or not? Groups create samples from a bag of numbers and calculate the sample means. Using the sample means as an estimate for the population mean, scholars try to determine whether the difference is real or not.
EngageNY
Characteristics of Parallel Lines
Systems of parallel lines have no solution. Pupils work examples to discover that lines with the same slope and different y-intercepts are parallel. The 27th segment of 33 uses this discovery to develop a proof, and the class determines...
Curated OER
Culture, Race & Ethnicity
Is there a difference between culture, race, and ethnicity? In order to celebrate Harmony Day and cultural diversity, your class will brainstorm, discuss, and discover that there is. The class splits into three groups, each group is...
Write Away!
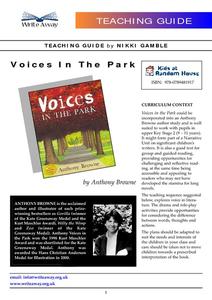
Voices In the Park
Explore the impact a narrator's point of view has on a story with a reading of the children's book, Voices in the Park by Anthony Browne. Written in four different voices, the story is told and retold from different perspectives to...
Howard Hughes Medical Institute
Battling Vector-Borne Diseases: Factors That Affect the Mosquito Life Cycle
Slow the spread of disease by slowing disease carriers in their tracks. Learners explore just how they might accomplish this as they experiment with the life cycle of a mosquito under different conditions. Scholars design and conduct...
University of North Carolina
Reorganizing Drafts
Poor organization often destroys an otherwise good paper. After writing a first draft, individuals consider the organization of ideas, a topic discussed in the 16th handout in the 24-part Writing the Paper series. The resource covers...
EngageNY
The Volume of Prisms and Cylinders and Cavalieri’s Principle
Young mathematicians examine area of different figures with the same cross-sectional lengths and work up to volumes of 3D figures with the same cross-sectional areas. The instruction and the exercises stress that the two figures do not...
EngageNY
Scale Factors
Is it bigger, or is it smaller—or maybe it's the same size? Individuals learn to describe enlargements and reductions and quantify the result. Lesson five in the series connects the creation of a dilated image to the result. Pupils...
EngageNY
Constant Rates Revisited
Find the faster rate. The resource tasks the class to compare proportional relationships represented in different ways. Pupils find the slope of the proportional relationships to determine the constant rates. They then analyze the rates...
EngageNY
Inscribed Angle Theorem and Its Applications
Inscribed angles are central to the lesson. Young mathematicians build upon concepts learned in the previous lesson and formalize the Inscribed Angle Theorem relating inscribed and central angles. The lesson then guides learners to prove...
EngageNY
Getting a Handle on New Transformations 1
In the first of a two-day lesson on transformations with matrix notation the class transforms the unit square using general transformations, then calculates the area of the transformed image. They discover it is the same as finding the...
EngageNY
The Computation of the Slope of a Non-Vertical Line
Determine the slope when the unit rate is difficult to see. The 17th part of a 33-part series presents a situation that calls for a method to calculate the slope for any two points. It provides examples when the slope is hard to...
EngageNY
Comparison Shopping—Unit Price and Related Measurement Conversions II
Which rate is greater and by how much? Pupils continue to compare rates to solve problems in the 20th portion of a 29-part series. Rates are presented in a variety of representations either using the same representation or different...
EngageNY
Summarizing Bivariate Categorical Data with Relative Frequencies
It is hard to determine whether there is a relationship with the categorical data, because the numbers are so different. Working with a familiar two-way table on super powers, the class determines relative frequencies for each cell and...
Beauty and Joy of Computing
Sprite Drawing and Interaction
Discover how to program objects to move on a screen. In the second lab of a five-part unit, each learner uses block instructions to program a sprite to follow their mouse (cursor). They investigate how to use these same block...
EngageNY
Connecting Graphical Representations and Numerical Summaries
Which graph belongs to which summary statistics? Class members build upon their knowledge of data displays and numerical summaries to connect the two. Pupils make connections between different graphical displays of the same data in the...
EngageNY
Comparing Data Distributions
Box in the similarities and differences. The 19th lesson in a unit of 22 presents class members with multiple box plots to compare. Learners use their understanding of five-number summaries and box plots to find similarities and...
Curated OER
Civil War Perspectives
Fifth graders have a debate and defend one of the three different perspectives of the Civil War. In this Civil War lesson plan, 5th graders defend either the North, the South, or the Neutral perspectives.
EngageNY
Comparing Distributions
Data distributions can be compared in terms of center, variability, and shape. Two exploratory challenges present data in two different displays to compare. The displays of histograms and box plots require different comparisons based...


