Curated OER
Can You See What I See?
Students gain an understanding of the methods used to explore the earth's surface. Students create a time line leading to the first satellite image of the Earth that includes the various methods utilized to observe the earth's surface.
Curated OER
Satellite Tracking
Students apply satellite tagging data to investigate questions related to open-ocean animals, their habitats, and their migratory behaviors. They determine how physical or biological factors determine organism behavior using a data...
Curated OER
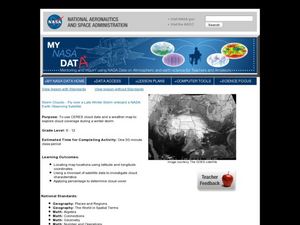
Storm Clouds-- Fly over a Late Winter Storm onboard a NASA Earth Observing Satellite
Students study cloud data and weather maps to explore cloud activity. In this cloud data instructional activity students locate latitude and longitude coordinates and determine cloud cover percentages.
Curated OER
A Look At Sunspots
Students research how the development of new technology has increased our knowledge of how the sun works. This lesson is part of a three-part series aimed at showing students how our knowledge of the universe must be inferred through the...
Curated OER
Creativity in Science
High schoolers view a video segment and discuss the technology and preparation that go into a satellite launch. They identify data that satellites can provide and consider how many people are involved in a satellite launch.
Curated OER
Trends of Snow Cover and Temperature in Alaska
Learners compare NASA satellite data observations with student surface measurements of snow cover and temperature. They practice data collection, data correlations, and making scientific predictions.
Curated OER
How Wet Did It Get?
Students measure the rainfall/snowfall on the playground on a rainy/snowy day with a rain/snow gauge. They draw a bar graph representing the amount of water that fell and observe a satellite image of the clouds and local weather system...
Curated OER
GPS Worksheet
In this GPS worksheet, students complete 6 fill in the blank questions about GPS satellite signals, receiver units and the acronyms used in GPS technology.
National Wildlife Federation
Get Your Techno On
Desert regions are hotter for multiple reasons; the lack of vegetation causes the sun's heat to go straight into the surface and the lack of moisture means none of the heat is being transferred into evaporation. This concept, and other...
Curated OER
Exploring Earth Through Maps and Technology
In this maps worksheet, students read 3 pages of detailed information about maps, latitude, longitude, topography, satellites and global positioning. Students then answer 10 questions. There is also a research project assignment available.
NASA
The Case of the Wacky Water Cycle
Join the tree house detectives in learning about the processes of the water cycle, water conservation, water treatment, and water as a limited resource.
Curated OER
A Bird's Eye View Of Your Community
Students locate and identify their community by using a satellite image from the Internet. Students locate and identify common land structures within their community. You may want to include structures such as roads/streets, houses and...
Curated OER
Book Excerpt from "The 23rd Cycle"
In this solar storms worksheet, learners read an excerpt from the book "The 23rd Cycle: Learning to Live with a Stormy Star". Students answer 7 questions about the effects of solar storms on radiation exposure, health risk of airline...
Curated OER
A Comparison of Cloud Coverage Over Africa
Students use a NASA satellite data to contrast amounts of cloud coverage over different climate regions in Africa. They explore how Earth's major air circulations affect global weather patterns, and relate to local weather patterns.
Curated OER
Birds on the Move
Students observe the migrational path of the Swainson's Hawk from northern Minnesota to the southern portion of South America. They study the migratory path of the hawk and observe how the vegetation in a particular region of the earth...
Curated OER
The Nature of Science and Technology
Students study the environmental concerns of orbital debris. In this orbital debris lesson students complete several activities.
Science 4 Inquiry
Deforestation
Young scientists observe deforestation from satellite photos and discuss the importance of forests to the global environment. They then simulate a plot of forest when farmers move into the area over the course of seven years. Finally,...
Curated OER
Television Goes Digital
Learners explore the difference between analog and digital televisions. They examine how the technology works and the impact of television through history. They also compare older television sets to ones found today.
Curated OER
Hawk in Flight
Students use information gathered by satellites to explore the migration of the Swainson's hawk from the western border of Minnesota to the southern portion of South America.
NASA
Water Works on a Blue Planet
Keep within a water budget. Learners find out that less than 2.5% of Earth's water is available to drink—and that there is a fixed amount of water. Scholars read an interesting article comparing the available water to a game of Monopoly...
Curated OER
Scientist Tracking Network
Students correlate surface radiation with mean surface temperature of several geographic regions. They observe how these parameters change with latitude and construct an understanding of the relationship of solar radiation to seasonal...
Curated OER
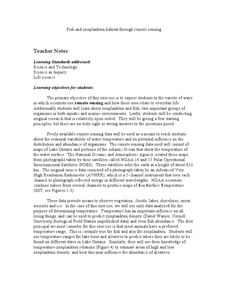
Fish and Zooplankton Through Remote Sensing
Ecology aces examine sea surface temperature maps and relate temperatures to concentration in fish and zooplankton populations. Take your class to a computer lab and provide experience with actual remote sensing data. Some of the links...
Curated OER
A Comparison Study of Water Vapor Data to Precipitation over North America
Students use NASA satellite data to compare water vapor over the United States. In this data analysis instructional activity students use an Excel spreadsheet to map their data.
NASA
Space-Based Astronomy on the Internet
Young scientists compile everything they have learned into a report in the fifth and final lesson in a unit on the visible light spectrum. Access to photos from observatories, telescopes, and satellites allows learners to compare and...


