NASA
Earth, Can You Hear Me Now?
How long did you say? Class groups plot the distances between Earth and Mars and determine the trigonometric function that models the data. Using a calculator, they graph the function to determine when the distance and communication...
Curated OER
Generating Hypotheses and Experimental Design 1
Here is a thorough exercise in forming hypotheses for scientific investigations. Young scientists consider factors that may be related to the question they would like to address. They think through measurable changes that may result from...
Curated OER
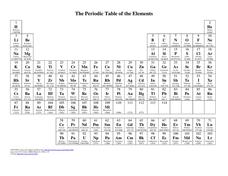
The Periodic Table of Elements
In this chemistry worksheet, students examine the periodic table of elements and use the data in other laboratory assignments.
South Penquite Farms
Measuring Soil Temperatures
Using an auger, start-up soil scientists bore a core of soil. They examine the sample and record the temperature at three depths in the borehole. This is an attractive activity sheet that succinctly guides your earth science class...
Curated OER
Random Sampling
In this random sampling worksheet, students compare data collected by a random sample to data collected by an actual count using pieces of paper with numbers written on them. They compare their data for the actual count to the random...
National Museum of Nuclear Science & History
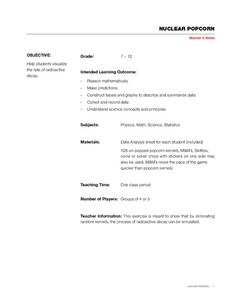
Nuclear Popcorn
Make your lesson on radioactive decay pop with this lab exercise. Using popcorn kernels spread over a tabletop, participants pick up all of those that point toward the back of the room, that is, those that represent decayed atoms. As the...
Curated OER
Freshman Project-Part 5
In this project learning exercise, 9th graders display their data, the make a graph and they answer analysis and conclusion questions on their experimental design project. They discuss the variables of their experiment, their major...
Curated OER
Reading Frequency Tables
In this data interpretation worksheet, students record the data from 10 examples into frequency tables. They group 10 more data sets, and make a frequency table for each.
Living Rainforest
Finding the Rainforests
From Brazil to Indonesia, young scientists investigate the geography and climate of the world's tropical rain forests with this collection of worksheets.
Curated OER
Food chains at sea
Fifth graders interpret a table of data about food chains in the ocean. They create a food chain to represent the information on the table. Periwinkles eat seaweed, and crabs eat periwinkles - so who eats crabs? Extend the activity with...
Curated OER
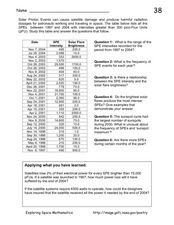
Solar Proton Events
On this worksheet, space scientists use a data table to answer questions about the relationship between the brightness of solar flares and the intensity of the solar proton events. They apply what they learned from the data to address...
Curated OER
How Does Water Cool?
How fast does water cool? First fifth graders will draw a line on a graph that predicts how fast they think water can cool from boiling. Then they plot the actual data on the same graph to see if their estimate was correct.
Balanced Assessment
Solar Elements
Let your brilliance shine like the sun. Future mathematicians and scientists consider given data on the abundance of different elements in the sun. The assessment task requires consideration of how these different abundances relate to...
Curated OER
Experiment Report (Normal Form)
Here is a handy handout to give any science class as a guide to writing lab reports. It is a blank outline that you can have aspiring scientists fill out when they experiment, or imitate as they record their experiments in a lab journal....
Curated OER
Making a Line Graph
In this line graph activity, students use data given in a table and assign axes, make a scale, plot data and make a line or curve on their constructed graphs.
Curated OER
High Temperature records by State
In this temperatures instructional activity, students view a spreadsheet of the high temperatures of the states and change the data on it using spreadsheet tools. Students complete 4 tasks.
Curated OER
Adopt a City-Winter Weather
In weather worksheet, learners use an on line site to collect weather data. They create 10 different weather scenarios using a temperature and humidity slider. They includethe temperature, relative humidity and weather conditions and...
Achieve
Ivy Smith Grows Up
Babies grow at an incredible rate! Demonstrate how to model growth using a linear function. Learners build the function from two data points, and then use the function to make predictions.
Adrian College
The Universe
Young scientists create a simulation of Hubble's law. Introducing the Big Bang Theory using balloons and a simple lab worksheet, scholars complete a data table and perform analysis.
Curated OER
Displacement vs. Distance Worksheet
Displacement is a foundational concept for physics pupils. If they are having trouble discerning it from distance, this activity can help clear things up. The first page is essentially a piece of graph paper. It has a compass rose and a...
Curated OER
Tables and Graphs Practice
In this table and graph worksheet, students are given three scenarios with data. They construct a table and a graph for each scenario.
Curated OER
Experiment Data Recording Sheet
In this science worksheet, students record data collected during a ten day experiment. They record the date and data collected for each of the ten days in a table on the sheet. They record the date since the data does not have to be...
Bowland
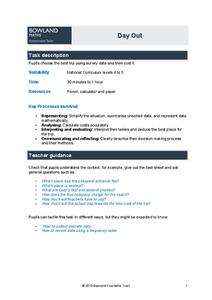
Day Out
Use mathematics to help plan a field trip. Scholars use the results of a survey to determine where a class should go on a field trip. They use provided data about entrance fees and mileage to calculate the cost per person of such a trip.
Curated OER
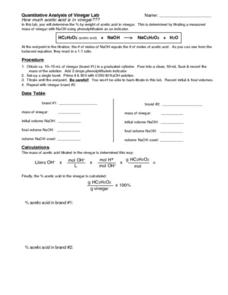
Quantitative Analysis of Vinegar Lab
In this quantitative analysis worksheet, learners perform a lab to determine the amount of acetic acid in vinegar by doing a titration. They use an indicator phenolphthalein to determine the endpoint of the titration.


