Teach Engineering
Energy on a Roller Coaster
Roll with your class into the idea of conservation of energy. Pupils use a roller coaster track to collect data to reinforce the concept of conservation of energy and the influence of friction. Class members then create a graph from...
Port Jefferson School District
Hurricane Katrina
Young scientists track Hurricane Katrina across the Atlantic Ocean as they learn about these destructive forces of nature. Provided with a table of data tracking the location and conditions of Katrina over a one week span, students plot...
Towson University
The Wildlife Forensics Lab
Can science put an end to the poaching of endangered species? Show your young forensic experts how biotechnology can help save wildlife through an exciting electrophoresis lab. Grouped pupils analyze shark DNA to determine if it came...
Curated OER
Moldy Jell-O
Mini mycologists plan an experiment to determine what affects the growth of mold on gelatin. A list of available materials is provided, but the procedure needs to be designed by the lab group. A data table is also provided in which to...
Curated OER
Observations of Properties of Matter
To guide learners through observations of chemical samples in the lab, this resource asks them to give all formulas and complete the attached data sheet. There are multiple questions about categories of elements and general behavior,
Curated OER
Acid-Base Indicators
The first two pages provide a chart to complete with results of a lab test using different solutions and indicators. The data analysis questions will help your students understand the concentrations of the solutions and how they affect...
Curated OER
Parts of Lab Report Review Sheet
In this lab report worksheet, students answer ten questions by filling in a blank with the appropriate letter that corresponds to the part of the lab. Students determine where data goes, where observations go, where answers to discussion...
Curated OER
Rate and Concentration
Experimental data for a chemical reaction is available in a table. Chemistry cohorts use critical thinking skills to analyze the data and answer questions about reaction rates and reaction order. This worksheet is neatly formatted,...
Education Development Center
Interpreting Statistical Measures—Class Scores
Explore the effect of outliers through an analysis of mean, median, and standard deviation. Your classes examine and compare these measures for two groups. They must make sense of a group that has a higher mean but lower median compared...
It's About Time
Volcanic Hazards: Airborne Debris
Pupils interpret maps and graph data related to volcanic ash. Then they analyze the importance of wind speed and the dangers of the ash to both life, air temperature, and technology.
Curated OER
Bluebirds Project
In this bluebirds project activity, students are given directions on completing a project about bluebirds including measurements, scientific method questions, data entry, and more. Students complete 15 exercises.
Curated OER
What are the Trends in the Periodic Table?
In this periodic trends worksheet, students fill out a portion of a periodic table with the atomic number, the atomic radius, the number of shells and the number of outer shell electrons for each element shown. They answer six questions...
Curated OER
Minerals Commonly Found in the Home
In this mineral worksheet, students collect 5 common household items that contain minerals and analyze them. After filling in a data table, students complete 3 short answer conclusion questions.
Curated OER
5th Grade Science
In this science worksheet, 5th graders complete multiple choice questions about flight, astronomers, measurement, temperature, and more. Students complete 25 questions.
Curated OER
Science Review for Grade 3 (3.5)
In this science review for grade 3 (3.5) worksheet, 3rd graders answer 25 multiple choice questions in standardized test format about fossils, simple machines and heat transfer.
Pingry School
Solubility Product of an Ionic Compound
How do scientists determine when a solution is fully saturated? Scholars address the topic as they observe patterns of precipitation in various concentrations of ions. Using a well plate, pipette, and common chemicals, they collect data...
Curated OER
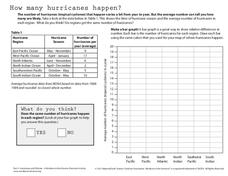
How Many Hurricanes Happen?
In this hurricanes worksheet, learners use a data table showing the hurricane region and the average number of hurricanes per year to determine if the same number of hurricanes happen in each region by creating a graph. Then students...
Curated OER
Boyle's Law
In this Boyle's Law worksheet, high schoolers investigate the relationship between the pressure and the volume of a gas at constant temperature. They use a syringe and a pressure gauge attached to a computer to collect their data. They...
Curated OER
Hurricane Frequency: Identifying Regions with Similar Numbers of Hurricanes
In this earth science worksheet, students answer 6 questions about the hurricane map and data provided. They create a data table based on the information provided on the map.
Curated OER
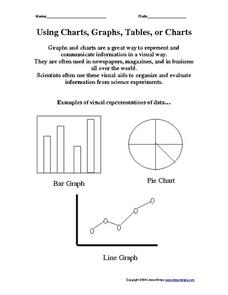
Using Charts, Graphs, Tables, or Charts
For this charts, graphs and tables worksheet, students view 3 different types of visual representations of data, make a list of 20 items and decide how the items can best be put together in groups to make a graph, chart or table....
Curated OER
How Do Astronomers Measure Distances to Stars?
In this astronomy learning exercise, students participate in an activity using the parallax effect to measure star distances. They record their information in a data table then complete 5 fill in the blank conclusion questions.
Texas State Energy Conservation Office
Investigation: Kinetic and Potential Energy
A well-developed lab sheet guides physical science learners through an investigation of kinetic and potential energy. In small groups, collaborators discover whether or not the ramp height or mass of an object has an effect on the...
US National Library of Medicine
Monster Genetics Lab
Harness young scientists' knowledge of genetics with an engaging science activity. Students start by flipping a coin to determine the genotypes and phenotypes of two parent monsters, before using Punnett squares to determine the...
Pingry School
Determination of the Percent Hydration and the Simplest Formula of a Hydrate
Does the crystal structure of a hydrated solid determine the proportion of water absorbed, or does the application of heat change the absorption? Scholars experiment with both variables to determine the answer. They add their collected...


