Teach Engineering
Let's Take a Spin: One-Axis Rotation
Investigate the effect of one-axis rotations on geometric figures. Scholars learn to use snap cubes and the right-hand rule to draw figures after rotations about the x-, y-, or z-axes. They try their hands at examples created by the...
Teach Engineering
Seeing All Sides: Orthographic Drawing
How can your draw three-dimensional figures on paper? The lesson shows pupils how to draw orthographic projections of three-dimensional figures composed of cubes. After viewing a PowerPoint presentation, they practice this skill with...
Curated OER
Risk Assessment and Geometry
Tenth graders study the concept of risk analysis as it relates to geometry. In this spatial relationship instructional activity, 10th graders are provided a set of coordinates to analyze a piece of land described. Students write a...
Curated OER
Where Should We Put a Store?
Students analyze population data. They convert population data into simple density maps to help make decisions about their world. They select the best location for a school store based on population density. They present their maps...
Curated OER
Tables, Charts and Graphs
Students examine a science journal to develop an understanding of graphs in science. In this data analysis lesson, students read an article from the Natural Inquirer and discuss the meaning of the included graph. Students create a...
Curated OER
Hurricanes and Climate
Students investigate maps and data to learn about the connections between hurricanes and climate. In this exploratory lesson students describe and graph the 6 regions where hurricanes happen and discuss how hurricanes have changed over...
Curated OER
Constructing Things
Students analyze the history and art in the Constructivism movement. For this art analysis lesson, students analyze and consider the material types in the art form. Students complete image based discussion. Students work in groups using...
Curated OER
Painting Modern Life
Examine three Cubism art pieces by Pablo Picasso and Georges Braque with your students. They will research how Cubism was advanced due to Picasso and Braque. and then compare and contrast Cubist works through image based discussion. Your...
Curated OER
Investigating Seasonal Variability in NO2 Concentrations
Young scholars study different formats of data and determine the nitrogen dioxide concentrations. In this seasons lesson students understand the different relationships that NO2 can have.
Middle Tennessee State University
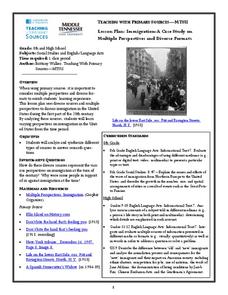
Lesson Plan: Immigration: A Case Study on Multiple Perspectives and Diverse Formats
As part of a case study of U.S. immigration during the first part of the 20th century, class members examine a variety of primary sources that present multiple perspectives of the responses of those in favor of immigration and those...
Curated OER
How High Is That?
Students explore the National Spatial Reference System. In this vertical position lesson, students will discuss the use of vertical position data and solve practical problems involving geographic positioning.
Curated OER
The Process of Art Criticism
High schoolers interpret possible meanings of works of art by analyzing how specific works are created and how they relate to historical and cultural contexts
Curated OER
Changing Planet: Permafrost Gas Leak
Pair earth scientists up to use an amazing online arctic portal mapping tool and Google Earth to analyze permafrost changes. They compare changes to data on atmospheric concentrations of methane to see if there is a correlation. Then...
Science 4 Inquiry
An Investigative Look at Florida's Sinkholes
In May of 1981, the Winter Park Sinkhole in Florida first appeared and is now referred to as Lake Rose. Scholars learn about the causes of sinkholes through an inquiry project. Then, they analyze recent data and draw conclusions to...
Curated OER
The Cricket in Times Square
Fourth graders explore vocabulary by reading a contemporary story in class. In this English literature lesson plan, 4th graders read the story A Cricket in Times Square and practice using the vocabulary words from the story. Students...
Curated OER
Gummy Bear Picture Graph
First graders investigate picture graphs. In this graphing instructional activity, 1st graders create a picture graph with the x-axis being number and the y-axis being color. Students sort their gummy bears by color and use pictures of...
Teach Engineering
Searching for Bigfoot and Others Like Him
Individuals create a GIS data layer in Google Earth that displays information about where one might find seven different cryptids. The class members research to find data on cryptid sightings they can include in their data layer.
Teach Engineering
What is GIS?
Is GIS the real manifestation of Harry Potter's Marauders Map? Introduce your class to the history of geographic information systems (GIS), the technology that allows for easy use of spatial information, with a resource that teaches...
Curated OER
World War II - War Comes to Hawaii
Ninth graders use geographic representations to organize, analyze, and present information on people, places, and environments. They use tools and methods of geographers to construct, interpret, and evaluate qualitative and quantitative...
Learner
Solid Shapes
A collection of two lessons, kindergartners will identify two-dimensional shapes in solid shapes. They will develop basic knowledge of the components that make up a sphere, rectangular prism, pyramid, cylinder, cone, and cube. Young...
Curated OER
Climate Change in My City
Students investigate the climate changes occurring locally, regionally and globally over the last one hundred years. They brainstorm and predict whether the current year's weather was warmer or colder than last year then check the...
Curated OER
The Landscape of a Novel
Young scholars, after reading a novel, utilize geographic skills to map out the places described in the novel. They collect data, envision spatial features and then design a map to work off of to complete their assignment. Each student...
Curated OER
"Dead-Zones" and Coastal Eutrophication: Case-Study of Chesapeake Bay
Take an in-depth look at nutrient loading, eutrophication, and hypoxia using data on The Chesapeake Bay as an example. This comprehensive presentation includes detailed graphs, photos, and details about the changes in marine organism...
Annenberg Foundation
Reading Maps
Can you read a map? Scholars use an interactive technology tool to analyze maps of various kinds to gather evidence and data to better understand their meanings and usefulness. Using newly obtained knowledge, they form an interpretation...


