Curated OER
Linear Motion 6
In this linear motion activity, students answer 12 questions about acceleration, velocity and distance traveled. They interpret diagrams and indicate the location of an object if it has positive, negative or no acceleration. They...
Curated OER
A Steep Hike
Students explore slope. In this middle school mathematics lesson, students analyze and interpret graphs as they investigate slope as a rate of change. Students use a motion detector to collect data as they walk at different speeds and...
Curated OER
Trigonometry
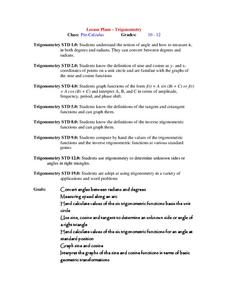
Students investigate angles converting them from radians to degrees. In this trigonometry lesson, students work with angles and the six different trig ratios. They graph the functions representing each trig functions and identify the...
Curated OER
Linear Motion 4
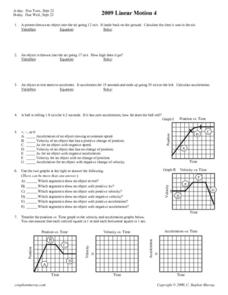
For this linear motion worksheet, students answer 12 questions including finding acceleration of moving objects, calculating distance objects travel and determining the time of travel. Students interpret graphs of position vs. time,...
Curated OER
HW Unit 10:2-Harmonic Motion
In this harmonic motion worksheet, students answer 9 questions about pendulums, a slinky and characteristics of harmonic motion. They identify the changes in waves as the amplitude gets bigger and interpret a graph of position vs. time.
Curated OER
Linear Motion in Class Test Review
In this linear motion worksheet, students answer 21 questions about acceleration, velocity, position and time. Students interpret graphs of position vs. time, velocity vs. time and acceleration vs. time. They calculate speed of objects,...
Curated OER
Gravity, Angles, and Measurement
Young scholars relate math to real life scenarios. For this geometry lesson, students launch a ball tracking each launch using a graph. They analyze their data for speed, angles and distance, trying to improve on each launch.
Curated OER
Hurricane Predictions
In this hurricane learning exercise, students analyze and interpret a hurricane graph. They complete 5 short answer questions that follow.
Curated OER
THEMIS: A Magnetic Case of 'What Came First?'
In this magnetic reconnection instructional activity, students solve seven problems using the data and graphs from the THEMIS satellite constellations, which show a series of events triggered by a magnetic reconnection. Students...
Curated OER
Lessons for Atlatl Users with Some Experience-Grade 6
Sixth graders experiment with an atlatl and dart. In this sixth grade data management mathematics lesson, 6th graders explore and determine the most suitable methods of displaying data collected from their experimentation with throwing...
Curated OER
Lessons for Atlatl Users with Some Experience-Grade 5
Fifth graders throw darts, collecting data for distance traveled. In this data analysis lesson, 5th graders throw a dart using an atlatl. They calculate the speed for each throw and determine the best dart length for distance throws.
Curated OER
The Sun Affects Earth
Third graders read, write, and listen to information about the sun and its effects on the Earth.as it relates to its axis, orbit, rotate, and revolution. In this solar system instructional activity, 3rd graders examine how the sun...
Curated OER
Surface Friction and Wear Characteristics of Common Materials
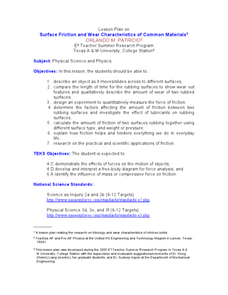
Students identify the factors affecting friction. In this physics instructional activity, students construct their own rocket car and race them. They graph the average speeds and discuss how lubricants affect friction between rubbing...
Noyce Foundation
Snail Pace
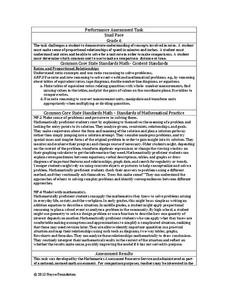
Slow and steady wins the race? In the assessment task, scholars calculate the rates at which different snails travel in order to find the fastest snail. Hopefully, your class will move much more quickly in finishing the task!
West Contra Costa Unified School District
Talking About Distance, Rate and Time
Connect the tortoise and the hare fable to mathematics. Learners first identify key terms related to distance, rate, and time. They then solve distance/rate/time problems using different representations.
Curated OER
Forces and Motion-The Downhill Racer
Students calculate a toy car's velocity and acceleration. In this force and motion lesson, students build ramps and attach a dropper to a toy car, which is released down the ramp. Students calculate and graph velocity and acceleration...
Curated OER
Swinging
Students examine and modify a swinging apparatus. They describe the motion of an object by its position, direction of motion, and speed. Students measure motion using a graph.
Curated OER
Weather Watchers
Learners collect and analyze data about the weather. In this algebra lesson, students organize and graph their data using graphs, line plots and stem and leaf plots. They make observation and draw conclusion using their data.
Curated OER
Race The Rapper: Slopes
Students calculate the slope of the equation For this algebra lesson, students graph coordinate pairs of linear equations and identify the relationship between x and y values and slope. They differentiate between functions and...
Curated OER
Geometry Coordinates
In this geometry worksheet, 10th graders calculate ordered pairs using a table to plot the coordinate pairs to make a graph. There are 3 graphing question.
Curated OER
Systems of Equations
Students solve systems of equations. In this algebra lesson, students use elimination and substitution to solve for the point of intersection. They use graphing to see where the two lines intersect.
Curated OER
Exploding Numbers
Students discuss how numbers increase when exponential growth is occurring. They view a video and compare exponential and linear growth with a graphing calculator.
Curated OER
Introduction To Data Analysis
Seventh graders investigate the concept of looking at the data put in a variety of ways that could include graphs or data sets. They analyze data critically in order to formulate some sound conclusions based on real data. Students graph...
Curated OER
Blowing in the Wind
Young scholars identify and interpret maps, graphs, charts, tables and political cartoons. Students identify what a compass rose is and review its meaning in relation to standard directions. Young scholars design their own weathervanes....


