Inside Mathematics
Quadratic (2009)
Functions require an input in order to get an output, which explains why the answer always has at least two parts. After only three multi-part questions, the teacher can analyze pupils' strengths and weaknesses when it comes to quadratic...
Agile Mind
Isabella’s Credit Card
An in-depth activity that involves a real-world problem about credit card debt. Learners are given a scenario in which Isabella plans to stop using her credit card and pay off the balance by paying a fixed amount each month. The first...
Curated OER
Using a Spreadsheet to Solve Gas Law Problems
High schoolers use a spreadsheet to solve gas law problems. In this gas laws lesson plan, students use the Express Calc program to load a spreadsheet for the gas law problems. High schoolers compute volume, temperature, or pressure...
Curated OER
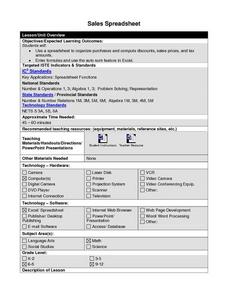
Sales Spreadsheet
Students use Excel spreadsheets to organize purchases, discounts, sales prices, and sales tax. Students follow step by step instructions and enter formulas as well as use the auto sum feature to calculate required calculations.
Curated OER
Iterating the Function and Complex Numbers
Students identify the end behavior of polynomial graphs. In this algebra lesson, students factor and solve quadratic and complex equations. They factor out negative roots and identify the real and imaginary parts of an equation.
Curated OER
Using Tables to Solve Linear Functions
Oh that intercept! Budding algebra masters solve linear equations from standard to intercept form. They identify the slope and y-intercept to help graph the lines, an then create coordinate pairs using a table of values. Great TI tips...
Radford University
Real World Data
Make math class feel more real by using real-world data. Scholars research or collect data on several different topics, such as nutrition, the motion of moving objects, cooling curves, and daylight hours. They create scatter plots using...
Kenan Fellows
Applying Linear Regression to Marathon Data
It's not a sprint, it's a marathon! Statistic concepts take time to develop and understand. A guided activity provides an opportunity for individuals to practice their linear regression techniques in spreadsheet software. The activity...
Curated OER
A Fishy Tale
Eighth graders do a research project on a particular species of Atlantic seafood and record and graph information pertaining to commercial landings of that species of seafood. They use a website and an Appleworks spreadsheet.
Curated OER
Creating a Spreadsheet
Students create a spreadsheet using ICT. In this algebra lesson, students collect and graph their data using a spreadsheet. They find solution to a given problem using trial and error.
Concord Consortium
Heights and Weights
Height is dependent on weight—or is it the other way around? Given data from a physicians handbook, individuals compare the height and weight of males and females at different areas. They calculate differences and ratios to assist with...
Curated OER
Sunrise, Sunset
What locations on Earth get the longest number of hours of daylight in the summer? Hint: It's not the equator! Use real-world sunrise and sunset data to develop trigonometric models that can be used to estimate the number of hours of...
Curated OER
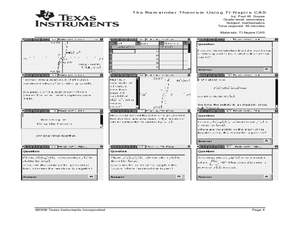
The Remainder Theorem Using TI-Nspire CAS
Investigate the Remainder Theorem in this algebra lesson. Explore the relationship between the remainders of polynomial division and the function. Each of the four problems gets progressively more complicated. This might be a great...
Curated OER
Spreadsheets - WP9/Quattro Pro
Pupils discover spreadsheet applications using Quattro Pro. They demonstrate basic knowledge and application of hardware, software, and Internet use. They recognize and appreciate the value of recording keeping, data input and data...
CK-12 Foundation
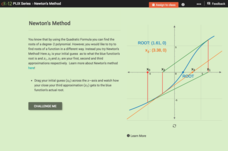
Newton's Method
Does the accuracy of the first guess make a difference down the line? Learners investigate the effects of the iterative process of finding roots, using Newton's Method. By moving the initial guess of a root on a graph, pupils observe the...
Curated OER
Linear and Exponential Models
High schoolers investigate the differences between linear and exponential models. In this linear and exponential models lesson, students make a table of given data. High schoolers determine if the data is linear or exponential by...
Curated OER
Data, Data, Everywhere... and What Am I To Think?
Students demonstrate good random sampling techniques for data collection, select and develop graphic presentations of data and analyze the data to solve a problem presented.
Curated OER
Thanksgiving Feast
Use the Tool Factory Workshop to have your class create a list of people to invite to their Thanksgiving Feast.They will take pictures related to the fall season and create invitations using Tool Factory Database. Students make a grocery...
Concord Consortium
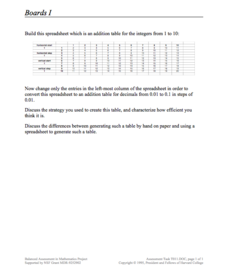
Boards I
Learners create patterns in a table to mimic the function of an electronic spreadsheet. The result is a table that creates an addition table for decimals in intervals of one-tenth. While creating the pattern, pupils must thoroughly...
Curated OER
Thinking Outside the Box
Now this lesson sounds fun! Students throw a ball, film it as it soars through the air, and use a spreadsheet to collect data. A scatterplot is created to produce a quadratic regression equation, an equation in vertex form, and an...
Curated OER
Discovering Pi
Define terminology related to a circle. Practice accuracy in measuring and then create a spreadsheet based on data collected from solving for parts of a circle. Groups can have fun analyzing their data as it relates to Pi.
Council for Economic Education
Using an Excel Checkbook
High school is the time that many scholars get their first jobs. Help young entrepreneurs apply economic principles to crucial skills for their new jobs and for functioning in society in general. They use Excel to balance a checkbook by...
Concord Consortium
Center of Population
Let the resource take center stage in a lesson on population density. Scholars use provided historical data on the center of the US population to see how it shifted over time. They plot the data on a spreadsheet to look the speed of its...
Curated OER
Modeling Population Growth
Learners create linear, exponential, and quadratic models of U.S. population data to determine which function best represents U.S. population growth. They predict future populations based on each model.


