Curated OER
Ocean Circulation
In this physical oceanography PowerPoint, viewers learn about ocean circulation, sea surface temperatures, and salinity. Relationships among these aspects are explained, as well as their impact on the atmosphere and climate. Each slide...
Beyond Benign
Breaking the Tension
The tension builds as learners experiment in your classroom. The 17th installment in a 24-part series has scholars investigate the concept of surface tension. After discovering characteristics of surface tension, they add a compound...
Curated OER
Measuring Soil Temperatures at South Penquite Farm
Students investigate soil temperatures. In this graphing and earth science lesson, students insert temperature probes into different types of soil at varying depths. Students complete a data chart and construct a related graph...
Curated OER
Surface Air Temperature Trends of the Caribbean
Students use real satellite data to determine the changes in near-surface air temperature at different times of the year over the Caribbean Sea. They discover how Earth's tilt causes seasonal differences in incoming solar energy. They...
Curated OER
Global Temperatures
Students analyze the global temperature record from 1867 to the present. Long-term trends and shorter-term fluctuations are both evaluated. The data is examined for evidence of the impact of natural and anthropogenic climate forcing...
Curated OER
Sea Surface Temperature Trends of the Gulf Stream
Learners use authentic satellite data to produce plots and graphs of sea surface temperature as they explore the seasonal changes of the Gulf Stream.
Curated OER
Measuring Temperatures
Fourth graders participate in a teacher-led discussion about temperature--hot and cold. Each group of students is assigned specific materials for their lab experiment. They record temperatures measured in their journals and then plot...
Curated OER
Sea Surface Temperature Trends of the Gulf Stream
Students explore the importance of the Gulf Stream. Using a NASA satellite images, they examine the sea surface temperature. Students collect the temperature at various locations and times. Using spreadsheet technology, they graph the...
Chicago Botanic Garden
Albedo, Reflectivity, and Absorption
What is reflectivity, and what does it have to do with the Earth's climate? As reflectivity is measured by albedo, scientists can gather information on Earth's energy balances that relate to global warming or climate change. Budding...
Curated OER
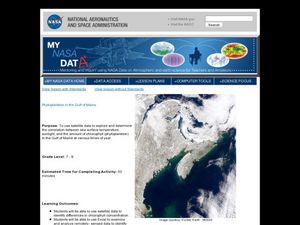
Phytoplankton in the Gulf of Maine
Students use satellite data to see the correlation between sea temperature and sunlight in the Gulf of Maine. In this phytoplankton lesson students use Excel to analyze data.
Curated OER
The Urban Heat Island Effect - Lesson 2 (Grade 5)
Fifth graders use the scientific process to examine how when various surfaces are exposed to similar environmental conditions, surface temperatures may vary. They conduct an experiment to show the relationship between surface and...
Curated OER
Investigating the Climate System: Energy, A Balancing Act
Earth science explorers design an experiment to demonstrate that the albedo of a surface affects its temperature. They test to find out if moisture on the surface affects temperature. They discover whether or not concrete or asphalt heat...
Curated OER
Sea Water Mixing and Sinking
Students investigate the role of temperature and salinity in determining seawater density. They use a Temperature-Salinity Diagram to examine the effects of mixing on density.
Curated OER
Is Grandpa Right, Were Winters Colder When He Was a Boy?
Young scholars compare current weather data to historic data to see if there is a temperature change. In this weather instructional activity students complete a lab activity and determine average changes in temperature, precipitation...
Curated OER
Feeling the Heat
Pupils record temperatures at different locations around campus. They examine the results and draw conclusions about how materials and colors affect the amount of heat produced. They also analyze Los Angeles' temperature records over a...
NASA
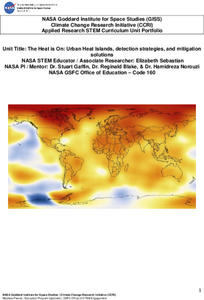
The Heat is On: Urban Heat Islands, Detection Strategies, and Mitigation Solutions
It's sure getting hot out there! Scholars analyze satellite data on land use and surface temperatures, and then learn how to ground truth satellite data through an activity. They apply technology to identify urban heat islands and...
Curated OER
The Urban Heat Island Effect - Lesson 2 (Grades 8-9)
Students use the scientific process to show that when various surfaces are exposed to similar environmental conditions, surface temperatures may vary. They examine the "urban heat island" phenomenon and analyze why it increases energy...
Curated OER
Measuring Solar Energy
Students study solar energy and how to measure it. In this energy sources instructional activity students complete a lab, obtain data and use that to convert surface temperature to energy.
Curated OER
Trends of Snow Cover and Temperature in Alaska
High schoolers gather historical snow cover and temperature data from the MY NASA DATA Web site. They compare this data to data gathered using ground measurements from the ALISON Web site for Shageluk Lake. They graph both sets of data...
Curated OER
Radiation Budget Lesson: Exploring Albedo
Students experiment with sunlight and temperature. They study the definition of albedo, or the percentage of incoming sunlight that is reflected, rather than absorbed.
Curated OER
Surface Area with Polydrons
Students explore measurements by analyzing geometric shapes. In this surface area instructional activity, students identify the terms volume, weight, perimeter and area in order to find the requested measurements of specific polygons....
Curated OER
Temperature and Enzymes
Students compare the times it takes the milk in each of two cups to curdle. They are told that an enzyme that is added to the milk, rennin, is involved in the natural curdling process of milk. Students are asked to consider what...
NASA
Earth's Global Energy Budget
Introduce your earth science enthusiasts to the earth's energy budget. Teach them using an informative set of slides that include illuminating lecturer's notes, relevant vocabulary, embedded animations, colorful satellite maps, and a...
Curated OER
Stellar Temperature, Size and Power
In this stellar temperature of stars worksheet, students use a given formula that relates the stellar light output with the surface area and temperature of a star to solve 3 problems. Students find luminosities of different stars and...
Other popular searches
- Sea Surface Temperature
- Surface Temperature Change
- Compare Surface Temperature
- Urban Surface Temperature
- Gulf Surface Temperature
- Surface Temperature Effects
- Measure Surface Temperature


