Curated OER
Creating Climographs
Young scholars use satellite data to compare precipitation and surface temperatures on different islands. In this satellite instructional activity students create graphs and explain the differences between weather and climate.
Curated OER
Cold Fronts
High schoolers determine its' direction of movement, and list at least five weather conditions associated with the specific front, given animations of several atmospheric variables during a cold front passage. They list at least three...
Curated OER
Clam Shell Data Collection Sheet
In this clam shell worksheet, students collect data about 10 clams and measure their length and width. They identify if the clam has a hole or not in its shell and they indicate the location profiled, date, time of day, tidal stage and...
Curated OER
Analysis of Atmospheric Conditions for a High Mountain Retreat
Students examine the relationship between altitude, atmospheric pressure, temperature and humidity at a particular location. They practice science and math in real world applications. They write reports detailing their scientific...
Curated OER
Hypothermia: Temperature Changes Under Varying Conditions
Students conduct an experiment to determine what type of clothing would be most suitable for outdoor activities. They determine the temperature changes of the skin under various wet clothing materials and graph the temperature changes. ...
Curated OER
Creating Station Models
Students work in groups to interpret weather maps. They use latitude and longitude readings to complete a worksheet together and turn in the worksheet along with the maps and a rubric.
Curated OER
Creating a Thematic Map Using S'COOL Data
Learners observe weather patterns, collect data, and make a weather predictions for various locations on a map.
Curated OER
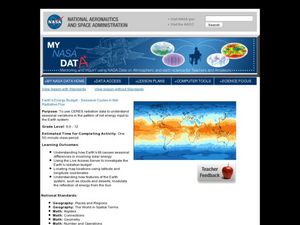
Earth's Energy Budget - Seasonal Cycles in Net Radiative Flux
Students attempt to understand seasonal variation by viewing images of the energy received by the earth. In this weather lesson, students view images from NASA of the influx of energy from the sun and make predictions about resulting...
Curated OER
Weather Whys- Cloud Watching Journal
Learners examine how natural processes change the earth by identifying their local water cycle. Individual students complete a cloud journal over a specific period of time. They observe clouds daily and take photographs of the clouds...
Curated OER
Agriculture, Weather, Economy and Indiana
Fourth graders, in groups, investigate the role of weather in Indiana's farming economy. They make a prediction as to weather and its effect on the economy of Indiana. They present their data using a media presentation of data...
Curated OER
Acid Rain
Students use real-time weather maps to determine the likelihood of acid rainfall in a region. Students apply their understanding of interaction between weather systems, land and air pollution, to address acid rain and the effects on...
Curated OER
Interplanetary Travel Guide
In groups of six, middle school space scientists create an imaginative travel brochure for attracting visitors to the planet Mars. Information must include surface features and atmospheric conditions. Although time-consuming, this is a...
Curated OER
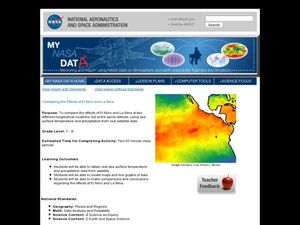
Comparing the Effects of El Nino and La Nina
Students examine the differences between an El Nino and La Nina year. For this investigative lesson students create maps and graphs of the data they obtained.
Curated OER
Cloud Observations using GLOBE Protocols
Students observe which of ten types of clouds are visible and how much of the sky is cloud covered. They see that by observing clouds, we can get information about temperature, moisture, and wind conditions in different places in the...
Port Jefferson School District
Climate Patterns
Young climatologists explore the factors that contribute to a region's climate in this two-part earth science activity. To begin, learners are provided with a map of an imaginary planet and are asked to label global wind and ocean...
Curated OER
Make it Rain!
Young scholars describe how water exists on earth in three states. They trace the path that rain water follows after it falls. Students describe various forms that water takes on the earth's surface and conditions under which they...
Curated OER
Analyzing Meteorological Data From Mars
High schoolers compare real-time Earth and Mars measurements for temperature, wind speed, humidity and atmospheric pressure by accessing Internet-data resources from NASA. They access real-time weather data and maps for their school...
Curated OER
High Mountain Retreat
Students explore and analyze atmospheric conditions for a high mountain retreat. They examine the relationship between altitude, atmospheric pressure, temperature and humidity at a particular location. In addition, they write reports...
Curated OER
Wind
Fourth graders watch an experiment that demonstrates the causes of wind. They design and make an original weather craft.
Curated OER
Sunken Millions: 3rd Grade
In this PowerPoint, students participate in a game with a quiz show format in which they answer questions about water. Topics include the water cycle, bodies of water, characteristics of water, and how water relates to weather...
NOAA
Climographs
In the second lesson plan of a five-part series, young climatologists use provided temperature and precipitation data to create climographs of three different cities. They then analyze these climographs to develop a general understanding...
University of Texas
Heat Transfer and Energy Balance
Learn about conduction, convection, and radiation with an illustrative presentation. It includes slides about atmospheric movement and how it affects the climate, solar radiation, and how latent heat can form storms.
Curated OER
Planet Research
Students recognize that the other eight known planets, which revolve around the Sun, have characteristics and surface conditions that are different from Earth; and identify examples of those differences.


