Curated OER
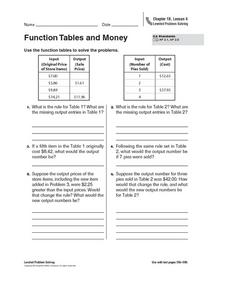
Function Tables and Money
In this function tables, money worksheet, students examine 2 different function tables, where they are given input information. Students determine the rule of the function table, then calculate the missing output values. The first table...
Utah Education Network (UEN)
Place Value is as Easy as Pie
After reading a short story, "Race for the Pie!," learners help the main character, Chett, win a cherry pie by counting out cherries. Cheery cherry cards and a game board are included for you to print out as manipulatives. The goal of...
Curated OER
Using Real-Data from North Dakota to Study Place Value, Rounding, Estimation, Fractions, and Percents
In this real-data activity, learners use data from the 2008 Census Bureau to answer eight questions divided into four activities. The topics covered include: place value, rounding, estimation, fractions, and percents.
CK-12 Foundation
Function Rules for Input-Output Tables: Function Machine 1
Challenge your classes to find the pattern of a double function machine. After recording the outputs of both machines, learners identify the pattern and the corresponding function. Both patterns involve adding/subtracting a constant.
CK-12 Foundation
Function Rules for Input-Output Tables: Function Machine!
Watch as a function machine converts an input to an output. Learners determine the work applied by the function machine to write a function rule. Questions accompany the function machine animation to guide individuals to conclusions.
Curated OER
Intersecting Graphs
Ninth graders know how to solve a system of linear equations, but what happens when the system involves an exponential function? The instructional slideshow teaches viewers to determine solutions to systems of equations with linear and...
Curated OER
Bug Me While I'm Eating!
Students explore nutritional value of insects as food, and compare the nutritional value of insects with that of their favorite foods by completing a table.
Illustrative Mathematics
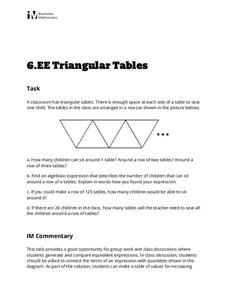
Triangular Tables
Somewhat of a puzzle, this problem gets pre-algebra preteens to write an expression representing a seating chart using triangle-shaped tables. This single task is an applicable lesson for meeting sixth grade Common Core math standards....
Pennsylvania Department of Education
What is the Chance?
Fourth and fifth graders make predictions using data. In this analyzing data lesson plan, pupils use experimental data, frequency tables, and line plots to look for patterns in the data in order to determine chance. You will need to make...
Illustrative Mathematics
Walk-a-thon 1
Your mathematician's job is to explore the relationship between hours and miles walked during a walk-a-thon. The activity compels your learners to experiment with different means in finding out this proportional relationship. The answer...
Curated OER
Electronegativities of Elements
In this elements worksheet, students use a table showing the electronegativity values of elements to characterize compounds as ionic or covalent. This worksheet has 14 fill in the blank questions.
Saxon
Plotting Functions
Youngsters use a graphing calculator to assist in creating a function table. They graph the function on a coordinate plane. They explore the relationship between the domain and range in the graph. This four-page worksheet contains two...
Yummy Math
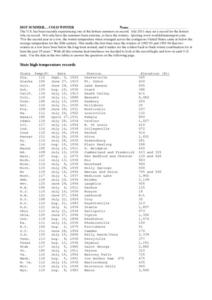
Hot Summer. . . Cold Winter
A table of each state's record temperature reports data that middle schoolers can place on a number line for analysis. A written explanation of how to use this tool and the concept of absolute value are also included. Nine questions are...
Curated OER
Reading and Writing Numbers
Reading and writing numbers is thoroughly covered in this well done slide-show presentation. Learners will see how number and number words correlate in relation to place value. The slide-show is text heavy and could use more visual aids...
Curated OER
Summary of Periodic Trends
This concise collection of images speaks volumes about the trends in the periodic table of elements. Different versions of the periodic table are displayed demonstrating different trends. Teachers' notes are included to assist your...
Illustrative Mathematics
Walk-a-thon 2
During a walk-a-thon your learners must determine the walking rate of Julianna's progress. Using tables, graphs, and an equation, they must be able to calculate the time it took her to walk one mile and predict her distance based on the...
Curated OER
What is the Best Chip?
Scholars collect data about chips. They pick their favorite type of chip from a given variety such as potato chips, tortilla, or banana chips. Then they write on an index card their favorite chip and why it's their favorite. They also...
Illustrative Mathematics
Two-School Dance
Who's ready for the dance? When two middle schools combine for a dance, your learners' job is to calculate the ratio of girls attending. Provided with three different solutions, you can choose from setting up a ratio, linear equation, or...
EngageNY
Why Call It Tangent?
Discover the relationship between tangent lines and the tangent function. Class members develop the idea of the tangent function using the unit circle. They create tables of values and explore the domain, range, and end behavior of the...
Curated OER
Now That's Using Your Head!
Explore linear measurement. Scholars will measure the circumference of their head and the distance they can jump. Information is recorded, averages are calculated, and a data table is completed. They then determine possible relationships...
California Mathematics Project
Viral Marketing
Math's gone viral—in the form of an exponential function! The activity uses an exponential function to model the growth of a marketing strategy. Learners create a table of values to observe the pattern in the numbers and then model the...
Curated OER
Problem Solving: Make a Table
In this problem solving worksheet, 2nd graders solve and complete 4 different problems that include counting different amounts of coins. First, they determine the number of nickels and dimes in each. Then, students determine the total...
Curated OER
Identify and Graph Linear Equations
Students investigate linear functions. In this mathematics lesson, students plot points onto a graph by solving the equations y=x and y=mx+b by being given numbers for x and solving for y.
Curated OER
Using Tables to Solve Linear Functions
Oh that intercept! Budding algebra masters solve linear equations from standard to intercept form. They identify the slope and y-intercept to help graph the lines, an then create coordinate pairs using a table of values. Great TI tips...
Other popular searches
- Graphs Table of Values
- Graphing Table of Values
- Graph Table of Values
- Functions Table of Values
- Using a Table of Values


