Curated OER
Subject Object Pronoun Practice
Practice substituting subjects and objects in a sentence with the correct pronouns. A grammar worksheet prompts young learners to fill in the blanks for ten missing subjects, and then ten missing objects in different sentences.
Curated OER
Intersecting Graphs
Ninth graders know how to solve a system of linear equations, but what happens when the system involves an exponential function? The instructional slideshow teaches viewers to determine solutions to systems of equations with linear and...
Curated OER
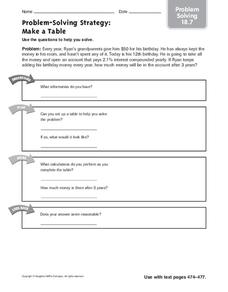
Problem Solving: Make a Table
In this making a table worksheet, 6th graders use the problem solving strategies of understand, plan, solve, and look plan, to solve a word problem.
1 plus 1 plus 1 equals 1
I Can Read! Sight Words Set #16
Now, there, of, and say are the sight words in focus in a printable packet in which you can use all, or some, of the activities to reinforce your early readers' sight word proficiency.
Curated OER
SAT Grid Ins Practice Test 09
In this SAT practice worksheet, high schoolers solve 10 grid in problems. Students find surface area, slope, mean, factors, etc.
Curated OER
Reading Frequency Tables
In this data interpretation worksheet, students record the data from 10 examples into frequency tables. They group 10 more data sets, and make a frequency table for each.
Curated OER
Setting the Table
In this how to worksheet, students will practice setting the table properly by using a paper place mat with the outlines of a plate, cup, napkin and silverware.
Curated OER
Multiplication Tables Using Microsoft Excel
Eighth graders are introduced to Microsoft Excel as a computer application software program. They create multiplication tables in Microsoft Excel. Students work in small groups. They discuss the $ (anchor) function in Microsoft Excel.
Mathematics Vision Project
Modeling Data
Is there a better way to display data to analyze it? Pupils represent data in a variety of ways using number lines, coordinate graphs, and tables. They determine that certain displays work with different types of data and use two-way...
Mathematics Vision Project
Module 9: Modeling Data
How many different ways can you model data? Scholars learn several in the final module in a series of nine. Learners model data with dot plots, box plots, histograms, and scatter plots. They also analyze the data based on the data...
Mathematics Vision Project
Module 2: Systems of Equations and Inequalities
The brother-sister pair Carlos and Clarita need your class's help in developing their new pet sitting business. Through a variety of scenarios and concerns presented to the siblings, the learners thoroughly explore systems of equations...
Shmoop
Box, Stem-Leaf, and Histogram
A helpful and versatile activity requires young mathematicians to analyze data in order to create graphs and answer questions. Additionally, it prompts learners to find the mean, median, mode, and range of some of the data sets.
California Education Partners
T Shirts
Which deal is best? Learners determine which of two companies has the best deal for a particular number of shirts. They begin by creating a table and equations containing each company's pricing structure. Individuals finish the seventh...
Willow Tree
Histograms and Venn Diagrams
There are many different options for graphing data, which can be overwhelming even for experienced mathematcians. This time, the focus is on histograms and Venn diagrams that highlight the frequency of a range of data and overlap of...
Curated OER
Describing Data
Your learners will practice many ways of describing data using coordinate algebra in this unit written to address many Common Core State Standards. Simple examples of different ways to organize data are shared and then practice problems...
Noyce Foundation
Ducklings
The class gets their mean and median all in a row with an assessment task that uses a population of ducklings to work with data displays and measures of central tendency. Pupils create a frequency chart and calculate the mean and median....
Charleston School District
Review Unit 4: Linear Functions
It's time to show what they know! An assessment review concludes a five-part series about linear functions. It covers all concepts featured throughout the unit, including linear equations, graphs, tables, and problem solving.
Rice University
Introductory Statistics
Statistically speaking, the content covers several grades. Featuring all of the statistics typically covered in a college-level Statistics course, the expansive content spans from sixth grade on up to high school. Material comes from a...
McGraw Hill
Lesson 12: Absolute Mean Deviation
Learn a different way to determine variability. An informative lesson provides directions on how to calculate the mean absolute deviation of a data set. Pupils use examples to learn the process and then practice finding the mean absolute...
National External Diploma Program Council
Finding an Average
Young hopefuls can practice finding the average of a group of numbers represented in tables and word problems.
Reed Novel Studies
Snow Treasure: Novel Study
What does it mean to be courageous? With the study guide for Marie McSwigan's novel, Snow Treasure, scholars answer questions about the text and practice new vocabulary. They also write quatrain poems about courage or another theme from...
Curated OER
Information at a Glance - Using Tables in Mathematics
Students create table to display GED Testing data located in paragraph provided by teacher, use information in table to create appropriate graph, and determine percentage difference between passing scores and failing scores.
Curated OER
Learning to Make Data Tables
Students construct data tables using the results of previous experiments. In this graphing lesson, students plot data and interpret the results. Students discuss how they organized their data.
Curated OER
Organizing the Elements
Ninth graders examine the periodic table and discover why the elements in the table are organized the way they are through research. Students infer information about the elements and the relationships among them that leads to their...


