Curated OER
Mathematics Lesson Plan
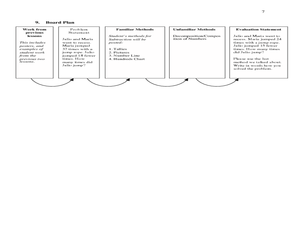
Second graders study subtraction facts. In this mathematics lesson, 2nd graders discuss how to solve two digit subtraction problems. Students recognize that there are many different methods or strategies one can use such as using...
Pennsylvania Department of Education
Freckle Face
Students collect and record data. In this early data analysis lesson, students gather data about their partners face. As a class, the students use tally marks and pictographs to record the data and answer question about the information...
Curated OER
Tally Charts and Graphs
Fourth graders play the game 'Data Picking', where they collect data, place the data into a tally chart, and choose the circle graph that best represents the data. They go to the Mathfrog website and select 'Picking'. Students choose...
Curated OER
Tallying Animals
Second graders draw a picture of a pond scene which includes various animals. They exchange pictures and tally the number of animals drawn. Then they record the number on a chart and write a story about their pictures.
Curated OER
Tally Charts
In this tally charts worksheet, students fill in the tally chart with the item, tally, and number. Students have 2 tally charts to complete.
Curated OER
Tally Marks Activity
In this tally marks learning exercise, students write tally marks for object shown. A reference web site is given.
Curated OER
Going Graph-y
Second graders listen to and dicuss the story Where the Wild Things Are. They play a pantomime game and act out various feelings so their classmates can guess. They listen for the frequency of certain words, and record their findings on...
Curated OER
Data Collection and Presentation
Middle and high schoolers collect and analyze data from four different activities. The activities include information about classmates, tallying colors of cars in a parking lot, stem and leaf plots, and making a histogram from winning...
Curated OER
Reading Bar Charts
Help kids understand how to collect data through surveys, organize data in a bar chart, then analyze their findings. There are three different surveys for learners to conduct, a full description of all the parts of a bar chart, and three...
Inspired By Kindergarten
Numbers 1-10
Preschoolers and kindergartners can master numbers 1-10 with a set of math worksheets. Each page features one number that kids trace, represent with tally marks, and write what number they will have after adding or subtracting 1.
CK-12 Foundation
Understand and Create Histograms: Histograms
Tally ho! Represent the frequency of ages at school. Pupils finish a tally chart to match the frequencies of ages at school. Using the frequencies, the learners create a histogram. With the aid of the histogram and the frequency table,...
Curated OER
Holiday Tally
In this tally chart worksheet, students ask ten friends which of 3 holidays they like best. Students create a tally chart with their results and answer 6 questions.
Curated OER
Collect and Organize Data - Practice 14.1
In this data collection worksheet, students read the word problem and study the tally chart about favorite sports. Kids then use the information in the chart to answer the questions. Students then use the list about students' favorite...
Curated OER
Counting Coins
Second graders identify a quarter, dime, penny, nickel, and dime. They match the coin with it's monetary value, collect data on excel spreadsheet, and create a graph in Excel. Students participate in group activities.
Curated OER
Taking Attendance
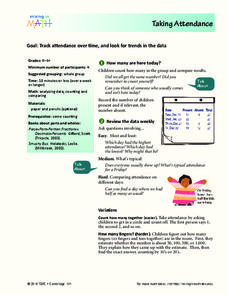
Young mathematicians record and analyze data. They will take attendance for their class and compare to other days. Then discuss ways to count who is present. They may also show the amount of students present using fractions.
Curated OER
Where We Live
Who has the most? Young learners practice charting data using familiar information. They help fill out a classroom chart by recording the number of people, pets, televisions, etc. in their home. Guiding questions help them investigate...
Curated OER
Organizing Data
Third graders investigate ways to organize data. In this tally marking lesson plan, 3rd graders practice drawing tally marks to represent an item of data. Students also make connections with skip counting by fives.
Curated OER
Tally Chart-
In this tally chart activity, 1st graders use tally marks to count. Students count the number of dinosaurs in each row, keeping a running tally beside each grouping.
Curated OER
Play or Film Review
Learners review the elements for a successful play review. In this play review lesson, students work in groups to complete peer responses, a consensus activity, and tally activity. Learners write a play review. A Peer Review Sheet is...
Curated OER
Dynamite Data
Second graders rotate through a variety of stations designed to offer practice in manipulating data. They sort, tally and count items and then create bar graphs, tables, and pie graphs to record their findings.
Curated OER
Favourite Colours
In this colors worksheet, learners survey 20 people on what their favorite color is. They mark the results using tallies. Students then take their data and put the totals in a frequency table.
Curated OER
Tally Chart
In this tally chart activity, 1st graders use tally marks to count. Students count the number of snowmen in each row, keeping a running tally beside each grouping.
Curated OER
Did You Eat That! - Food Graph
In this health and diet instructional activity, students ask ten of their friends what their favorite vegetables are. Then they tally their votes and shade them in on the graph provided.
Curated OER
Organizing and Interpreting Data
In this organizing and interpreting data learning exercise, students solve and complete 10 different problems related to reading various data tables. First, they complete the 3 charts shown with the correct tally amount, frequency...
Other popular searches
- Tally Charts
- Tally Marks
- Tally Charts and Pictographs
- Tally Charts and Tables
- Tally Charts or Pictographs.
- Math Tally Charts
- Primary Tally Charts
- Sorting and Tally Charts
- Tally Charts Mode
- Using Tally Charts
- Lucky Charms Tally Charts
- Tally Table, Graph


