Curated OER
Count it, Glue it, Read it!
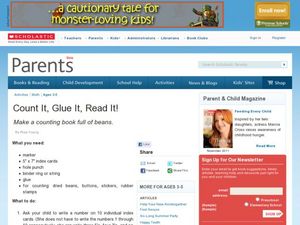
Students identify numbers 1-10 and count objects to match corresponding numbers. In the number sense lesson, students create a counting book, matching numbers they've written on index cards with the correct number of items (beans,...
Curated OER
Survey on Climate Change
For this climate change worksheet, students read through the sentences and answer the questions that survey them about their knowledge of climate change.
Curated OER
Graphic Favorite Breakfast Foods
Second graders graph data based on a class survey of their favorite breakfast foods. In this graphing lesson plan, 2nd graders take a class survey of their favorite breakfast foods. Then they take that data and put it into a computer...
Curated OER
Favorite Fairy Tales
For this favorites survey worksheet, students poll their classmates, teachers, parents, and friends about people's favorite fairy tales. Students complete the chart with the information.
Curated OER
The Games Divided
In these Olympic history worksheets, students read about the ancient Olympic games and the modern games. Students complete a Venn diagram to compare and contrast the past and present Olympic games.
Curated OER
Counting by Grouping Into Tens
In this counting worksheet, learners group sets of objects by grouping them into sets of ten, circling as they count. Page 3 is a "teacher guide."
Curated OER
Graph and Compare the Adventure's Temperature Vs. Local Temperature
Students explore the concept graphing data. In this graphing data activity, students use weather data from their local weather and some other city and graph them. Students plot the local weather vs. another city. Students record...
Curated OER
Graphing Data
Second graders examine how to make and read bar graphs. In this bar graph lesson, 2nd graders compare bar graphs to pictographs by looking at hair color survey data. They practice making a bar graph and finding the range of the data.
Curated OER
Embracing Diversity
Ninth graders discover that the amount surveyed affects the results and conclusions drawn from a survey. In this sampling lesson students explore the concept that a valid conclusion require a large number of entries. Students calculate...
Curated OER
Graphing Words Word Search
In this data vocabulary worksheet, students search for 16 graph-related words in a word search grid. Each word relates to graphing and collecting data.
Curated OER
Jeopardy Game
Students create and play a game of world history Jeopardy. In this world history lesson, students follow the provided instructions to write questions for a game of Jeopardy and then play it.
Curated OER
Looking at Different Species
Young scholars research a species of bug that they find in a pond. In this species lesson students work in groups and find the similarities and differences between different species of bugs.
Curated OER
The Letter "L"
Students practice using the letter "L." In this letter "L" lesson, students complete a worksheet (not included) on which they identify pictures of items that begin with the letter "L."
Other popular searches
- Tally Charts
- Tally Marks
- Tally Charts and Pictographs
- Tally Charts and Tables
- Tally Charts or Pictographs.
- Math Tally Charts
- Primary Tally Charts
- Sorting and Tally Charts
- Tally Charts Mode
- Using Tally Charts
- Lucky Charms Tally Charts
- Tally Table, Graph


