Curated OER
Are You Here Today?
Students recognize their own name in print and the names of their classmates. They use one to one correspondence to determine who has not checked in, completed their field, and if absent indicate that on the form. Students tally the...
Curated OER
Tally Time
Students create a tally chart. In this math and health lesson plan, students discuss healthy foods and create a tally chart showing the number of students who like to eat healthy foods.
Virginia Department of Education
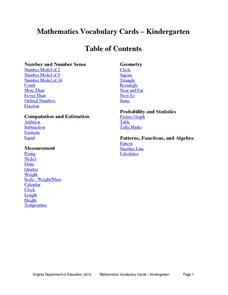
Mathematics Vocabulary Cards - Kindergarten
Enhance your math lesson with a series of pictures that illustrate different math concepts. The vocabulary includes a variety of ideas and pictures including fractions, ordinal numbers, picture graphs, and number lines.
Curated OER
Atlatl Lessons Grades 4-12: Lesson for Beginning Users of Atlatl
Sixth graders determine the mean, range median and mode of a set of numbers and display them. In this data lesson plan students form a set of data and use computer spreadsheet to display the information. They extend of the process by...
Curated OER
Lessons for Atlatl Users with Some Experience-Grade 6
Sixth graders experiment with an atlatl and dart. In this sixth grade data management mathematics lesson, 6th graders explore and determine the most suitable methods of displaying data collected from their experimentation with throwing...
Curated OER
The Write Stuff
Fourth graders share a previously written portfolio piece and the class guesses the genre. Students use tally marks to keep track of how many of each piece there are in class. Once the data collection is complete, 4th graders create a...
Curated OER
Dynamite Data
Second graders rotate through a variety of stations designed to offer practice in manipulating data. They sort, tally and count items and then create bar graphs, tables, and pie graphs to record their findings.
Curated OER
Excel Lesson Plan Coin Statistics
Second graders determine the difference between making a prediction and determining actual information. They design a spreadsheet for a coin flipping activity on which they include their predictions and what actual happens when they flip...
Curated OER
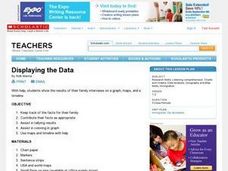
Displaying the Data
Students gather facts about their parent's families through the completion of parent interview forms. Using tally marks, the data gathered is counted, transferred to graphs and used to create family timelines.
Curated OER
Graphing Data
First graders learn how to display data using a bar graph. In this bar graph lesson plan, 1st graders use data from a t-shirt color survey to make a bar graph. They also make an animal bar graph before interpreting the information.
Curated OER
Investigation-What are My Chances?
Second graders explore probability. In this math lesson plan, 2nd graders discuss the possibility of choosing a certain colored tile from a bag. Students perform experiments and describe the outcomes as certain, possible, unlikely and...
Kelly's Kindergarten
April Daily Resources
Spring has sprung in your classroom! An entire month of activities relating to spring prompts learners to color, draw, write, and work on phonics.
Curated OER
Spelling Lesson Plan: Make a Word Race: Class Teams
Young scholars practice their spelling words. In this spelling skills instructional activity, students play a game that requires them to race to the front of the classroom to spell their spelling words before the other team does.
Curated OER
Agriculture Counts
Students discuss the kinds of things they count and how to use tally marks. In this social science lesson, students count animal crackers by using tally marks for each kind of animal. The tally marks are changed into numbers and one...
Curated OER
Investigation - What Does 1,000 Look Like?
Second graders determine what 1,000 items look like. In this math investigation lesson, 2nd graders collect 1,000 items and determine the best way to count them by tens and hundreds. They can use stickers on notecards to count to 1,000....
Curated OER
Pop Tops
Get your class primed for a comparative analysis lesson with this activity. They compare and contrast their music preferences to those of their classmates. After reading an article, they identify current trends in popular music, analyze...
Curated OER
Survey Surfing
Students survey other students and record the information on a chart using tally marks. They record their favorite fish and their favorite foods, and share the results with the class.
Curated OER
Water Cycle: Weather Lesson 1
First graders go on a water walk, collect weather data, and measure rainfall for a month. They examine the water cycle in this series of lessons.
Curated OER
Probabilities for Number Cubes
Students explore the concept of probability. In this probability lesson, students roll a six-sided number cube and record the frequency of each outcome. Students graph their data using a frequency chart and keep tally marks in a...
Curated OER
Gender Equity: I Said, She Said
Students collect and analyze data on classroom participation. In this gender equity lesson, students use tally marks to collect data on the sex and numbers of students who participate in classroom discussions. Students work in small...
Curated OER
Many Ways to Represent Our Data
Demonstrate several ways to represent data with your class. They will use surveys to gather data and display the data using tally charts and graphs. Then answer questions according to the data.
Curated OER
Oceans
First graders examine how the earth is covered with more water than land. They toss an inflatable globe around the classroom, and each time a student catches the ball with two fingers, they tally whether the fingers land on water or...
Illustrative Mathematics
Comparing Numbers
Young mathematicians spin their way to a deeper number sense with this fun, collaborative activity. Using two spinners, one with the numbers 0-9 and the other with the decades 00-90, pairs of students take turns building and comparing...
Curated OER
Fly Swatter Spelling
Young scholars practice spelling words by swatting fake insects. In this vocabulary lesson plan, students participate in a spelling game in which teams must spell a word correctly one letter at a time. Young scholars may fix one...


