Curated OER
Blast Off
In this physical science exploration, small groups place a piece of antacid tablet into a film canister and step back to time how long it takes for the top to pop. They repeat the activity, altering either the amount or temperature of...
Curated OER
Water Chestnut Graphing Activity
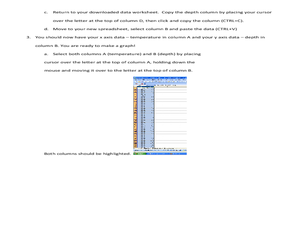
Students are taught how to format and enter data into an Excel spreadsheet. They make a graph and interpret graphed data. Students discuss possible impacts of water chestnut invasion. They graph data on water chestnut. Students report...
Curated OER
Healthy Water!?
Middle schoolers test water for its quality and record their information.In this water quality lesson, students investigate water for pH, macro invertebrates and identify its characteristics. Middle schoolers complete worksheets on their...
EngageNY
Conversion Between Celsius and Fahrenheit
Develop a formula based upon numerical computations. The 31st part of a 33-part unit has the class determine the formula to convert a temperature in Celsius to a temperature in Fahrenheit. They do this by making comparisons between the...
CK-12 Foundation
Determining the Equation of a Line: Temperature Conversion Challenge
Line up the temperature conversions. Pupils create the linear function between Celsius and Fahrenheit on a graph by plotting the freezing and boiling points of water. The scholars determine how the relationship changes based upon...
Curated OER
Water 1: Water and Ice
Students examine the changes as water goes from solid to liquid. In this states of matter lesson plan, students observe and record the changes to water as it changes from solid to liquid and back to solid.
Curated OER
Is There Liquid Water on Mars?
Students assess whether there is liquid water on Mars by analyzing images and data. In this planetary lesson students analyze temperature and pressure graphs and hypothesize about how water could have flowed on Mars.
Curated OER
Is There Water on Mars?
Young scholars decide whether or not there is or has even been water on Mars. They analyze temperature and pressure data from the Pathfinder mission to Mars, and then they analyze images of Mars, interpreting the landforms they see and...
Curated OER
Water Cycle, Weather, and Climate
Eighth graders investigate the water cycle and its processes. They examine temperature and precipiation data to classify climate of ten cities. They then create a climate map of the world.
Curated OER
Ocean Currents and Sea Surface Temperature
Students use satellite data to explore sea surface temperature. They explore the relationship between the rotation of the Earth, the path of ocean current and air pressure centers. After studying maps of sea surface temperature and ocean...
Curated OER
The Effect of Dissolved Salt on the Boiling Point of Water
Explore the properties of solutions with a lab activity. Chemistry fans determine the boiling point of water, add salt to create a solution, and then repeat the process four more times. They design their own data table and then graph the...
Curated OER
Clean Water vs. Dirty Water
Students study the importance of clean water to the survival of organisms and what activiities and material pollute water. They measure the temperature of water samples and create a class graph.
Curated OER
WATER QUALITY FOR FRESHWATER ORGANISMS
Students use determination of dissolved oxygen and water temperature changes to determine the environmental impact from thermal pollution.
Curated OER
Graphing Water Temperature
Students graph water temperature using probe software and a Palm on a class field trip to a lake or pond. Emphasis is placed on collaboration with high school science students and the use of ImagiProbe software.
Centers for Ocean Sciences
Ocean and Great Lakes Literacy: Principle 1
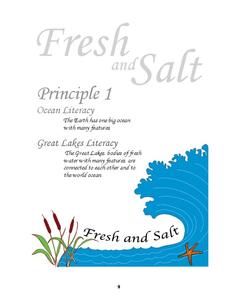
Is your current lesson plan for salt and freshwater literacy leaving you high and dry? If so, dive into part one of a seven-part series that explores the physical features of Earth's salt and freshwater sources. Junior hydrologists...
Curated OER
Cold, Clouds, and Snowflakes
Students explore satellite data and graphing. In this weather data analysis math and science instructional activity, students analyze NASA satellite data to draw conclusions about geographical areas where precipitation might have...
Curated OER
A Day at the Beach
Help learners determine the rate of change for the temperature of sand. They will collect data on the temperature of wet and dry sand over time with a heat lamp overhead. Then make a scatter plot of the data and find a linear model to...
Curated OER
Comparing the Effects of El Nino and La Nina
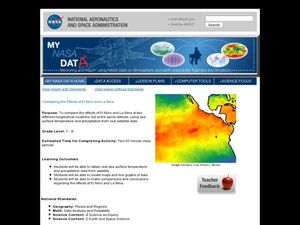
Students examine the differences between an El Nino and La Nina year. For this investigative lesson students create maps and graphs of the data they obtained.
Curated OER
Missing Macroinvertebrates - Stream Side Science
Field study groups collect samples of stream water and identify the macroinvertebrates found. Using their data, they calculate a water quality index to rate the health of the stream. They graph their data and discuss the value of a water...
Center for Learning in Action
Water – Changing States (Part 2)
Here is part two of a two-part lesson in which scholars investigate the changing states of water—liquid, solid, and gas—and how energy from heat changes its molecules. With grand conversation, two demonstrations, and one hands-on...
Curated OER
Properties of Fresh and Sea Water
Learners work with three stations to demonstrate the properties of water. They explore water's boiling point, freezing point, and its ability to store heat.
Curated OER
Teaching About the Properties of Water
Students use video, Internet research, graphs and tables, worksheets and hands-on experiments to investigate the properties of water in a lake environment. They work under direction or through an inquiry process.
Curated OER
Using Excel to Reference and Graph Live Data from a Web Site
Students collect live buoy data about water temperatures in the Gulf of Mexico from the Internet and work individually to organize their data and create a line graph using Excel Spreadsheet. Students analyze their data and examine any...
Curated OER
What's A Water Column Profile?
Students investigate water column data. In this earth science and seawater lesson, students determine how temperature, salinity, and density have an impact on sea water by viewing and analyzing data obtained from a number of websites....


