Curated OER
Sound Walk: Discovering Data and Applying Range, Mode, and Mean
Elementary schoolers sharpen their listening skills as they use sound maps, tallies, and line plots to organize and interpret data. Everyone takes a "sound walk," and focuses on the sounds around them. They chart and tabulate the sounds...
Curated OER
Coming Full Circle
Students develop and design their own clothing line in this Visual Arts lesson about the intricacies of the fashion world. Emphasis is placed upon current and vintage designs, famous designers, and the development of individual design...
Energy for Keeps
Renewable Energy Action Project: What's in Your Energy Portfolio?
Uncover the renewable energy potential in your region. The activity outlines an approach to research current practices and trends. Learners conduct surveys to assess the attitudes of the local population and prepare a paper summarizing...
US Environmental Protection Agency
Weather and Climate: What's the Difference?
Future weather forecasters collect daily temperatures over a period of time. Afterward, they compare their data with monthly averages, as researched on national weather websites, in order to grasp the difference between weather and...
Population Connection
Where Do We Grow from Here?
Did you know that the population is expected to grow to 11 billion by 2100? The resource serves final installment in a six-part series on the global population and its effects. Scholars interpret data from the United Nations about the...
EngageNY
Ferris Wheels—Tracking the Height of a Passenger Car
Watch your pupils go round and round as they explore periodic behavior. Learners graph the height of a Ferris wheel over time. They repeat the process with Ferris wheels of different diameters.
EngageNY
The Motion of the Moon, Sun, and Stars—Motivating Mathematics
What does math have to do with the behavior of the earth and sun? Learn how the movement of celestial bodies has influenced the development of trigonometry. Scholars connects the details in mathematics to their real-world meaning.
Curated OER
Cities
Students examine U.S. Census figures. In this urban centers instructional activity, students compare city populations across the span of 50 years. Students create line graphs based on the data.
Curated OER
Cinco De Mayo
High schoolers make a graph identifying the immigration of Mexicans to the US. In this algebra lesson, students practice graphing as they review different trends in immigration over the past 100 years. They interpret and analyze their...
Curated OER
Historic Population Chart
Students examine the changes in the population in Idaho over a specific amount of time. In groups, they use the digital atlas to identify the trends in the population and describe why and how they exist. To end the instructional...
Curated OER
Graphing Sea Ice Extent in the Arctic and Antarctic
Students graph sea ice data and predict long term trends in the data. In this climate change lesson, students use sea ice data from the Arctic and Antarctic to construct line graphs. They use their graphs to predict the effects of global...
Curated OER
Exploring Linear Equations And Scatter Plots - Chapter 5 Review
Students complete rolling stocks experiment, and collect and enter data on the computer. They enter data on graphing calculators, complete scatter plot by hand with line of best fit, and discuss different graphing methods.
Curated OER
Fused Glass Landscape
Students research and recognize work of several glass artists such as Chihuly, Tiffany, and Wright, define landscape and other relevant vocabulary terms, and create full fused glass plate/bowl using landscape and/or nature as subject...
Curated OER
Graphing
Students collect data and graph their results, then analyze the graphs. In this geometry lesson, students examine slopes and their graphs and discuss the relationship between the lines and the slopes.
Curated OER
Naming Fractions
In this math worksheet, learners will focus on fractions. Students will complete a fraction chart and then draw the lines in various shapes to represent the given fraction.
Curated OER
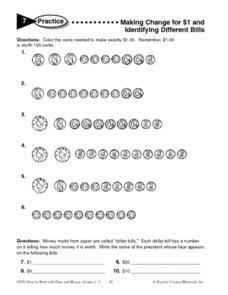
Making Change for $1 And Identifying Different Bills
In this making change for one dollar and identifying different bills worksheet, young scholars color the coins needed to make exactly $1.00 on six different lines. Students also examine how to utilize a chart to solve money problems.
Curated OER
October Writing Journal
In this writing worksheet, learners use a story starter for each day of October to keep a journal of daily writing. Students may make a book by coloring the cover sheet, stapling the story starter page and coloring the decorated lined...
Curated OER
Daily Journal Topics: My Community
In this social studies worksheet, students study their community by keeping a journal of writing. Students color the cover picture and use the lined paper which has room for a picture for daily writing. There are 10 thought-provoking...
Curated OER
Meet the Corals Online
In this science worksheet, young scholars are directed to a Web site where they will do research about coral reefs and types of coral. Students answer 15 questions with facts they learn on line.
Curated OER
The Effects of Light Intensity and Wavelength on the Rate of Photosynthesis
High schoolers use an on line website to simulate the effects of light intensity and wavelength on photosynthesis. In this photosynthesis lesson plan, students determine how wavelength of light and intensity of light affect the rate at...
Curated OER
Animal Families
In this identifying the names of animals' young and names of animals' groups worksheet, students draw lines to connect the correct answers. Students write 30 answers.
Curated OER
Facebook and Social Networking
Students explore Internet communication by researching Facebook. In this social networking lesson, students discuss the uses for Facebook, their own experience with the program, and the dangers of using on-line communication tools....
Curated OER
Birds' Eggs
More than just data, scatter plots are full of information that can be used to answer a variety of questions. This lesson uses a plot with information about bird egg sizes to answer questions about the relationship between length and...
Statistics Education Web
Saga of Survival (Using Data about Donner Party to Illustrate Descriptive Statistics)
What did gender have to do with the survival rates of the Donner Party? Using comparative box plots, classes compare the ages of the survivors and nonsurvivors. Using the same method, individuals make conclusions about the gender and...


